Microsoft Learn:
released Feb 13th, 2024
Summary of What's New in this Release of Visual Studio 2022 version 17.10 Preview 1
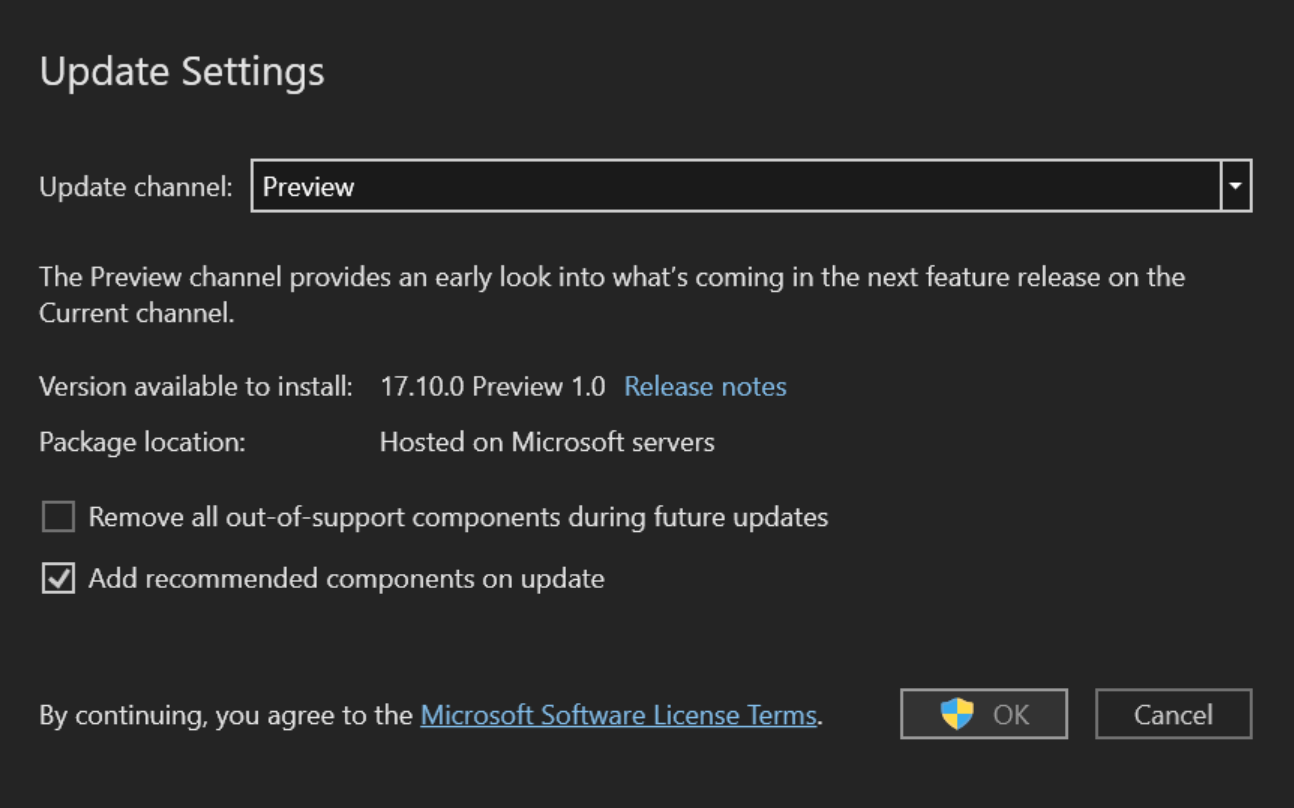
Visual Studio Updates will now include Recommended Components
Visual Studio offers a diverse array of tools and features for your coding tasks. As new technologies emerge, we integrate new components to enhance your software development experience. Some of these components will be recommended additions to the workloads you've already installed. So, to streamline your update experience, starting with 17.10 P1, Visual Studio will automatically install these new recommended components when you update Visual Studio.You can modify this setting in the Update Setting Dialog:
For the list of all components in Visual Studio, including recommended components, see Visual Studio Component IDs
Improved detection of Android emulator performance impacts
Visual Studio will check for hardware acceleration when attempting to start the Android emulator and will display helpful dialogs explaining potential performance impacts. If your machine isn't configured or doesn't support hardware acceleration with the Windows Hypervisor Platform (WHPX), the Android Emulator hypervisor driver (AEHD) is now required. The Intel Hardware Accelerated Execution Manager (HAXM) is deprecated from Android emulator API level 33 and higher, and has been replaced by AEHD on Intel processors.For more information, see How to enable hardware acceleration with Android emulators (Hyper-V & AEHD)
Support for MCD (Multi-Column Distribution) in SSDT
Developers will now be able to set the DW compatibility level during export. We have added a new database option in the Database Settings under the "Operational Tab", it is referred to as "DW Compatibility Level". Possible values include Auto|10|20|30|40|50|9000, these are valid for Target - Microsoft Azure SQL Data Warehouse.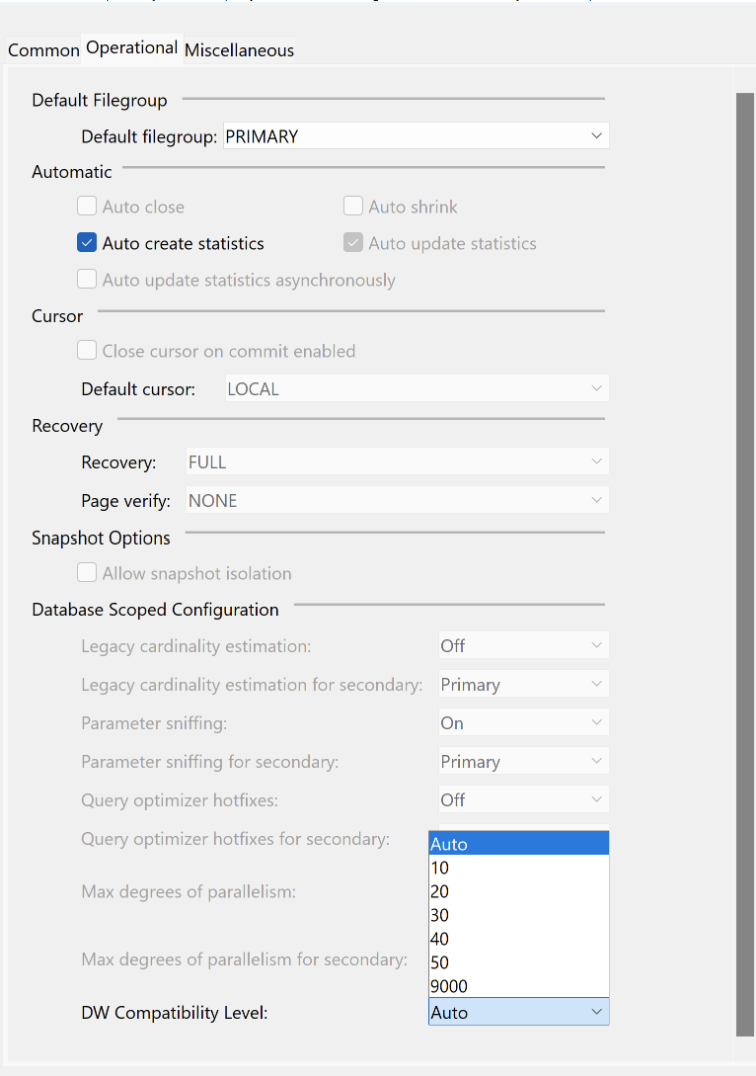
Debugging and Diagnostics
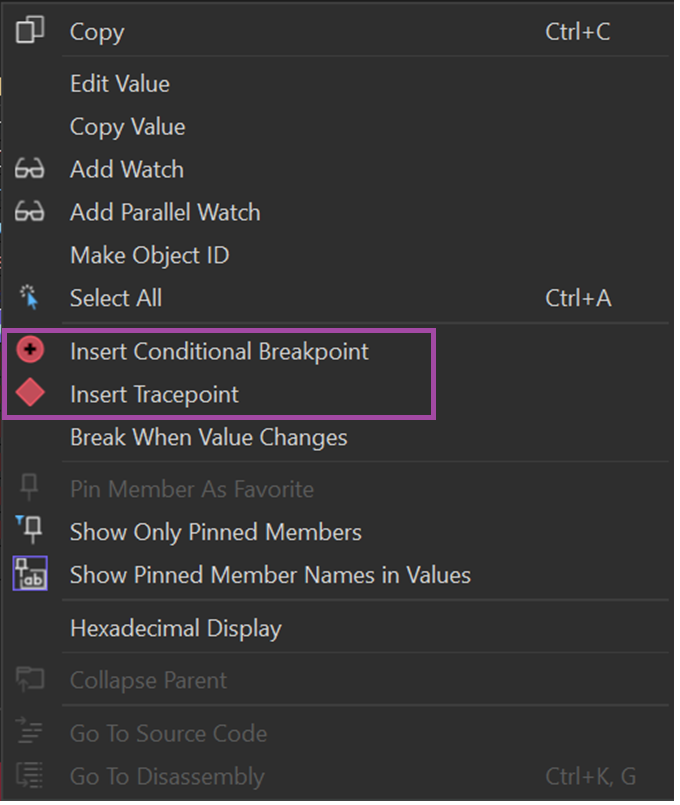
Creating Conditional Breakpoints and Tracepoints from ExpressionsThis upgrade simplifies debugging with new menu options: "Insert Conditional Breakpoint" and "Insert Tracepoint." You can now create breakpoints effortlessly using property or field names and values from autos, locals, watch windows, or DataTips. This makes debugging workflows easier, especially for complex expressions.
Simplifying memory usage investigations with the Memory Tool
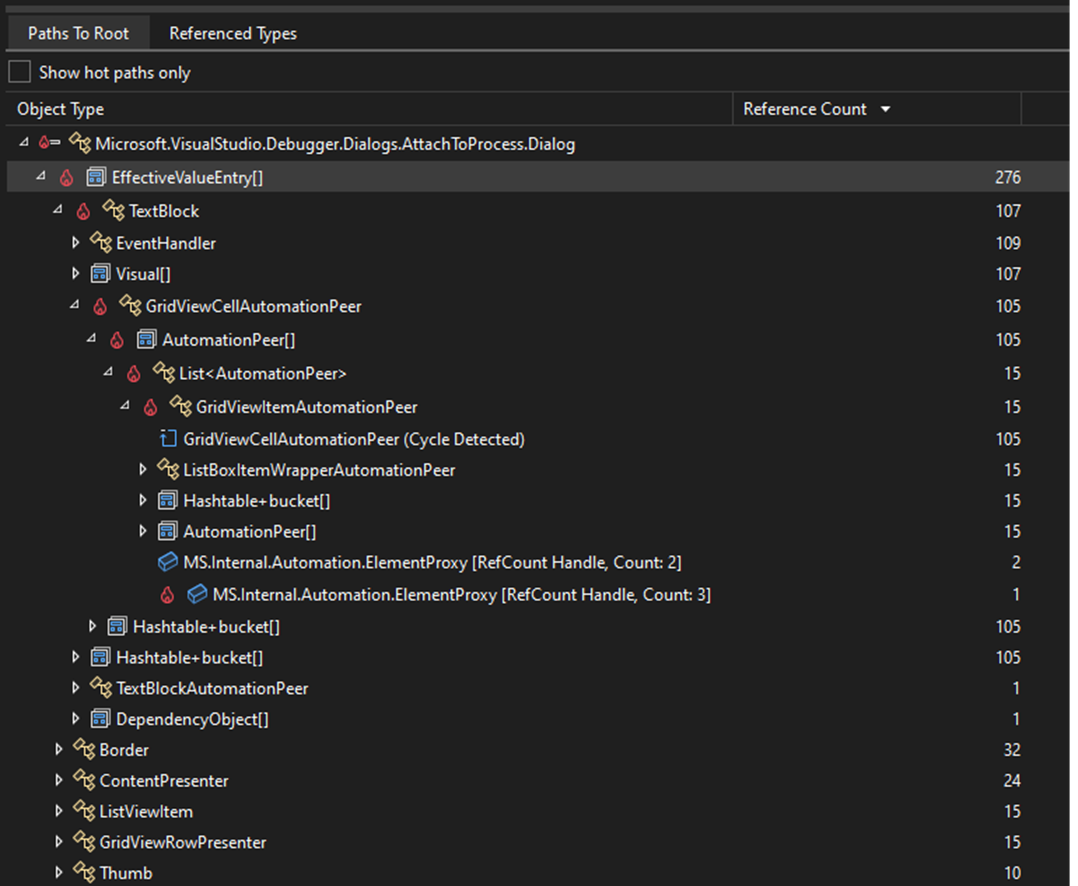
The new "Hot Path to Root" feature improves memory analysis by finding the most likely path to the root for calculating an object's total size. It transforms the heap graph into a tree, using shortcuts like prioritizing the shortest path and avoiding cycling paths to actual roots. This feature is a great starting point for memory investigations, known as the "Hot Path to Root" in the Memory Usage tool reference graph. You'll spot the hot path with a red icon in the tree below.
Attach to Process Dialog Revamp
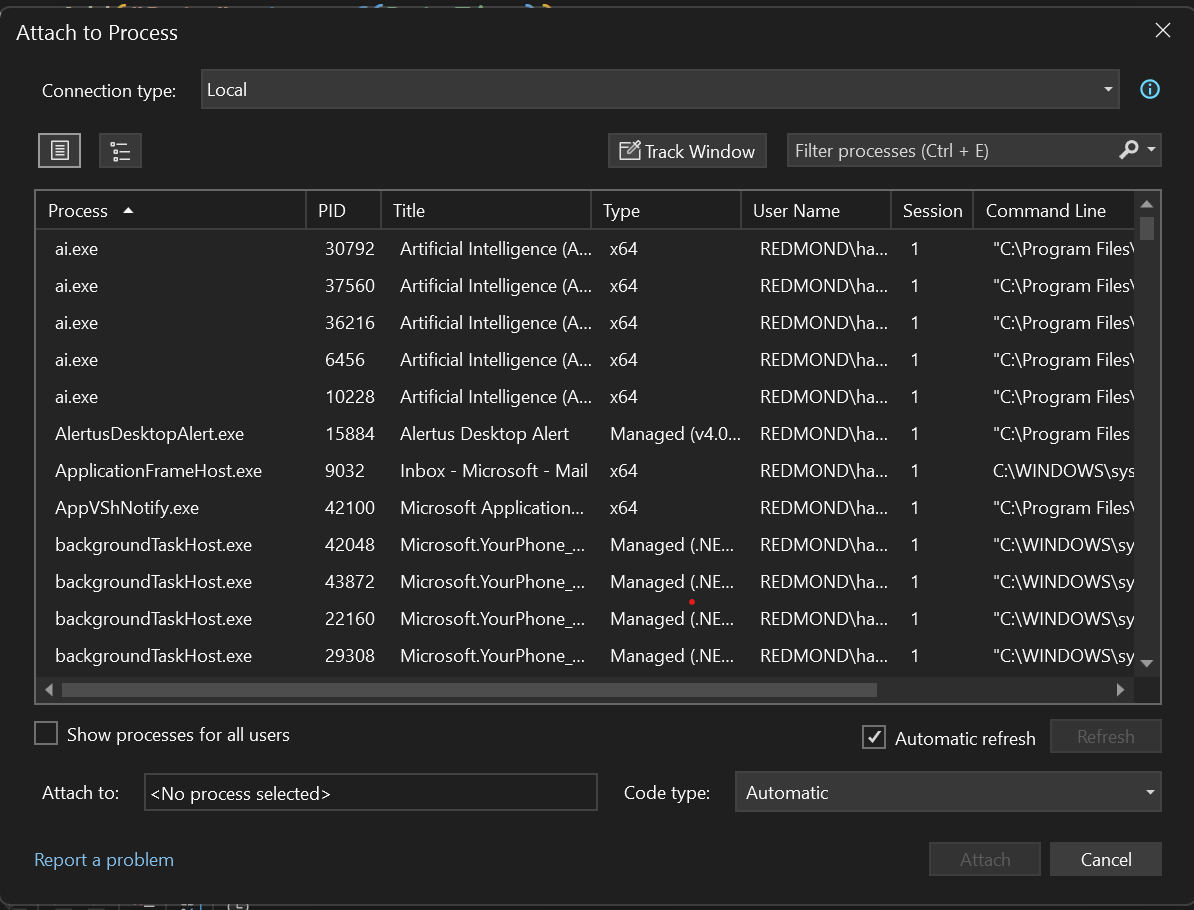
The Attach to Process dialog in Visual Studio has been greatly improved for better functionality and user-friendliness. These updates include seamless integration with Visual Studio themes, a more space-saving view with tooltips for connection info, and setting "Local" connection as the default for faster access. You can now easily switch between tree and list views, organize processes better with collapsible sections, and select code types with a simplified combobox. Moreover, the “Select/Track Window" feature is now easier to use, allowing two- way tracking, selecting a process highlights its window, and clicking on a window selects its process.
Targeted Instrumentation for EXE
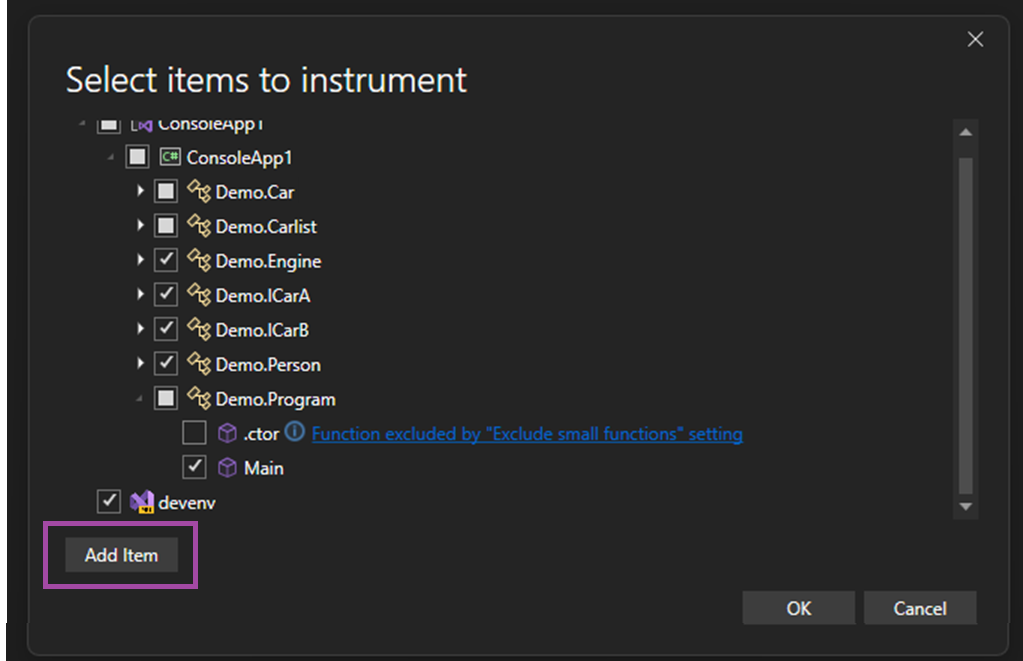
The Performance Profiler's Instrumentation Tool now allows targeted profiling for any executable (exe) file. After selecting an exe file, a targeted instrumentation dialog appears, similar to startup project profiling. This enhancement enables focused analysis of performance metrics for specific executables. Additionally, you can broaden the profiling scope by including extra Dynamic Link Libraries (DLLs) using the 'Add Item' button, enhancing the examination of application performance.
Preview Unified Settings, the new Visual Studio settings experience
Starting with Visual Studio 17.10 Preview 1, you'll be able to try out an early preview of Visual Studio's reimagined settings experience. While we're still working on the overall experience and are still in the process of moving settings over to the new experience, you'll be able to try it out and share your feedback today.With the new settings experience, it's now easier than ever for you to configure, share, and store your customized settings. You'll have more room for configuring settings, the ability to customize settings at both the user (Visual Studio install) and open solution/folder level, enhanced settings search capabilities, JSON-based storage of your settings, and more.
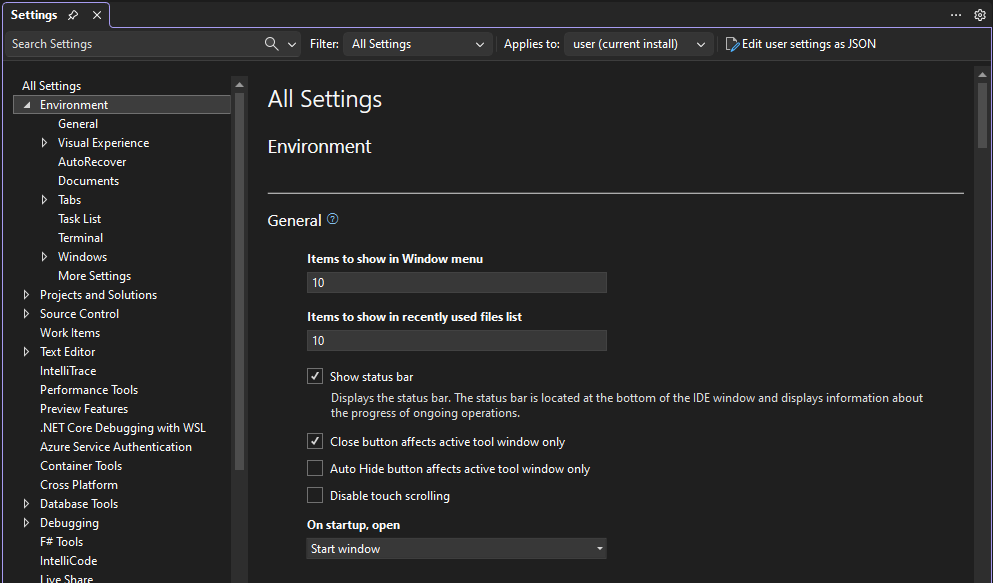
In addition to what was mentioned above, you'll now find a gear icon that opens a menu for each setting. That menu gives you an easy way to reset customized settings to their default values or share feedback with us on a particular setting.
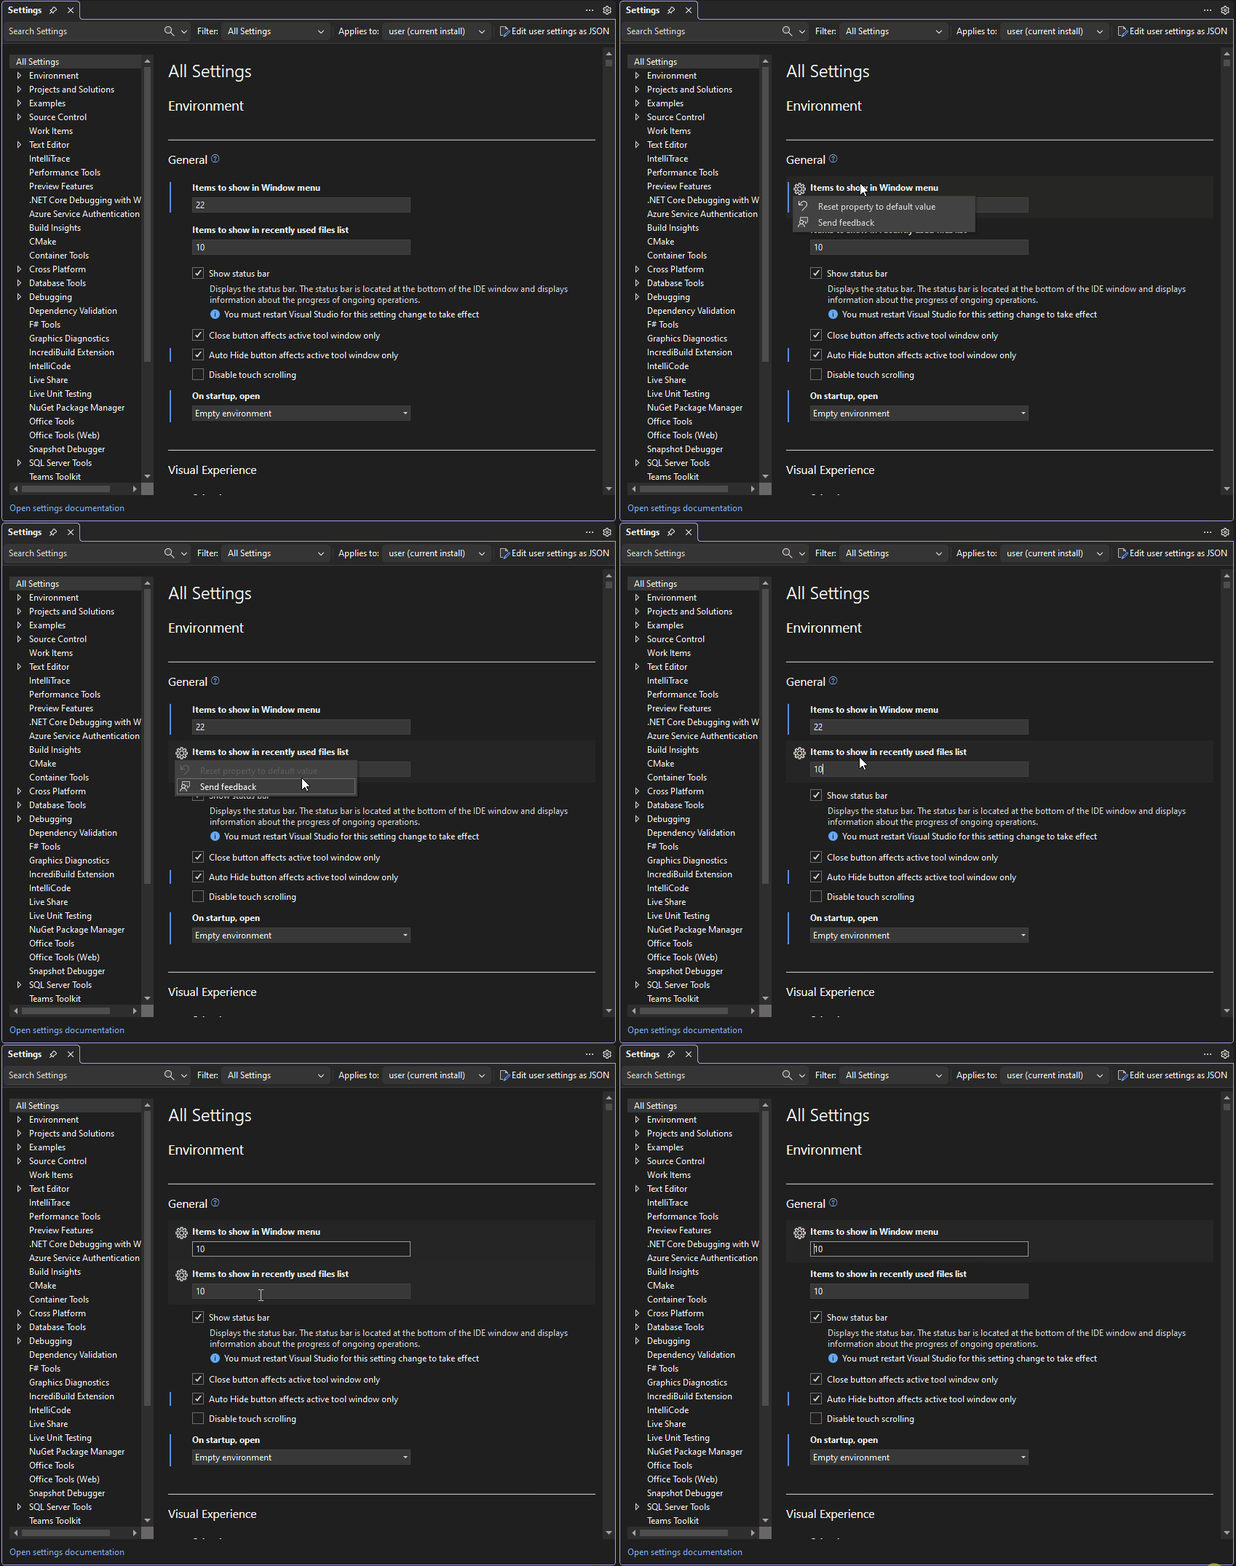
To try the new settings experience, navigate to Tools > Options > Environment > Preview Features and nable the "Unified Settings Experience" checkbox or use the Tools > Options Experience menu flyout to switch from "Classic" to "Preview". Once you've done that, restart Visual Studio and access the new settings experience via Tools > Options.
This feature is still in active development. While all settings pages haven't been migrated from the existing experience to the Unifed Settings experience, you'll still be able to manage all of your settings as Unified Settings will link over to the old UI for non-migrated settings.
Your feedback will be invaluable in helping us prioritize which pages we migrate next. In addition to which pages you'd like to see migrated next, please share your overall impressions, how we can improve it, and any additional feedback you may have on this experience via Developer Community.
Build cloud native apps with .NET Aspire
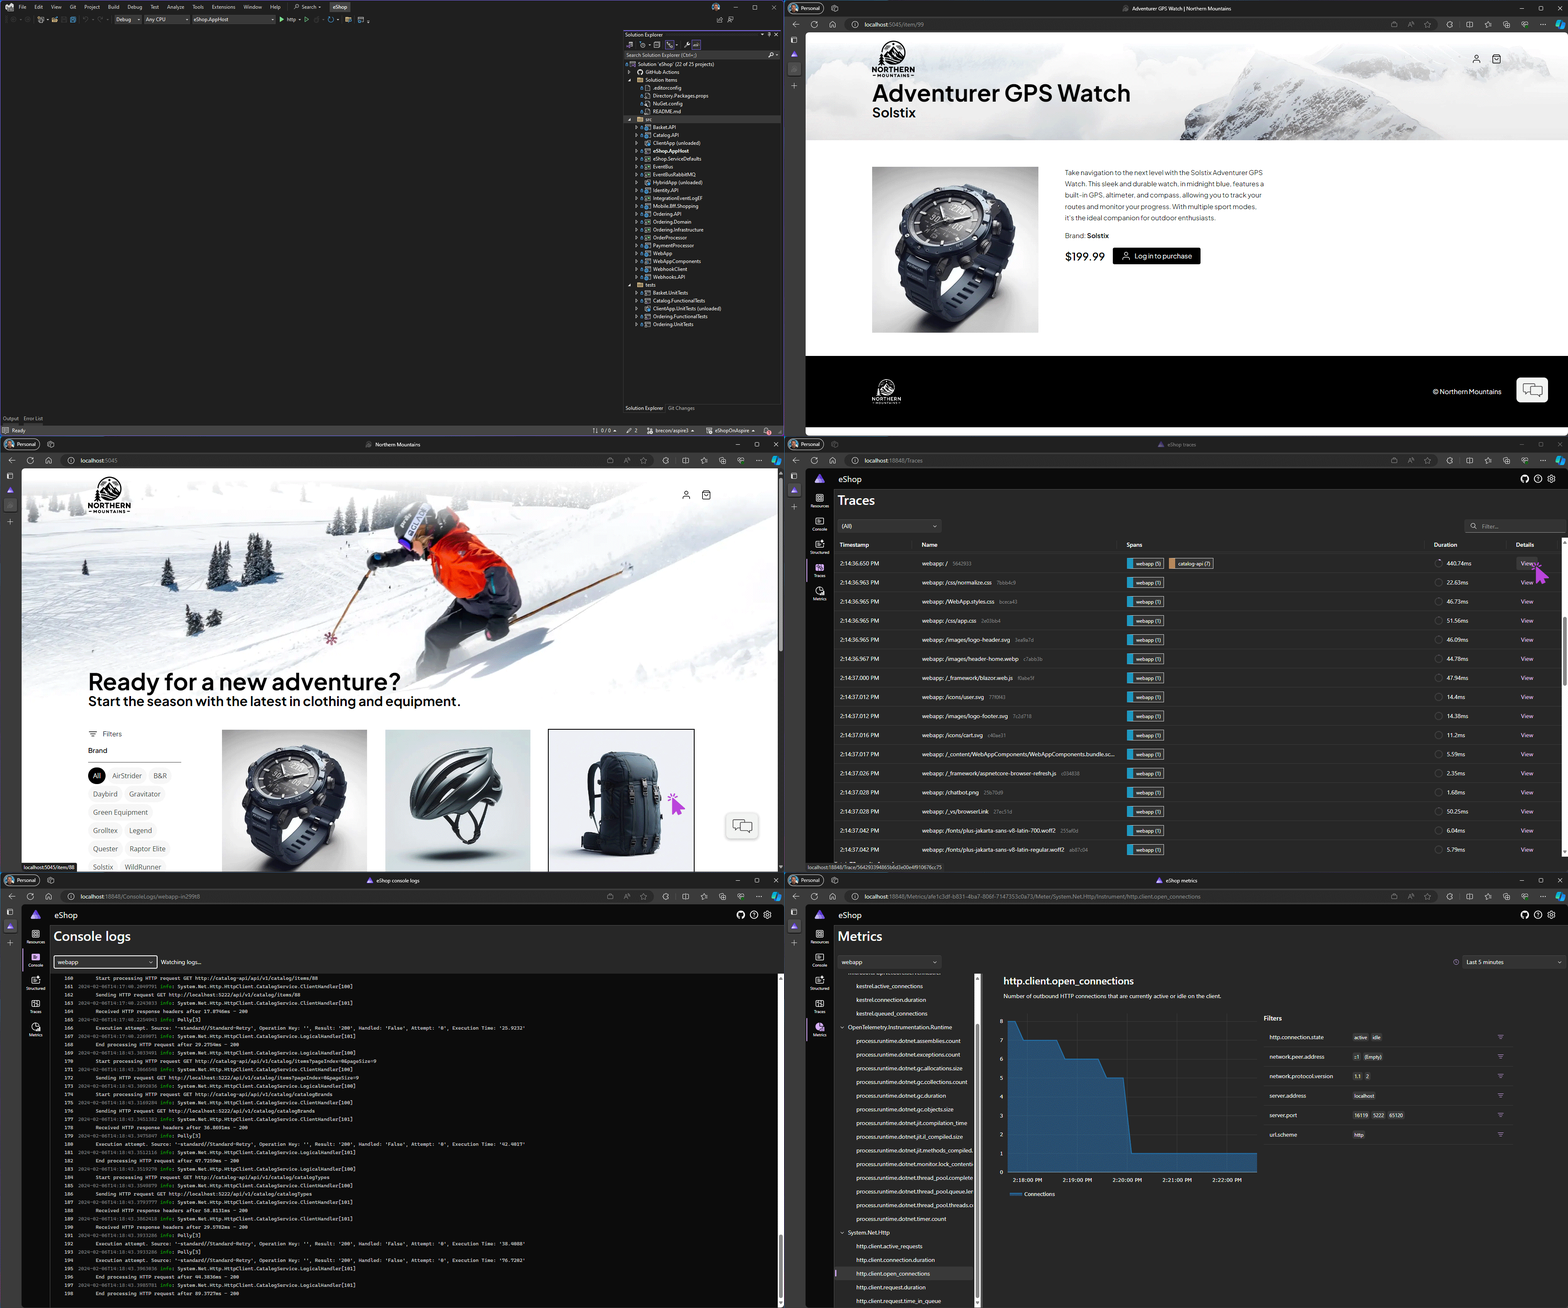
.NET Aspire is an opinionated, cloud ready stack for building observable, production ready, distributed applications. .NET Aspire is delivered through a collection of NuGet packages that handle specific cloud-native concerns. Whether you're building distributed, cloud-native applications using containerized resources like PostgreSQL and Redis, or Azure components like Storage or Service Bus, .NET Aspire will simplify your development experience and give you more visibility across your distributed apps with features like:
- Multi-project startup and debug without needing to configure your solution
- Built-in support for HTTP resiliency, health checks, and OpenTelemetry using a set of opinionated extensions and defaults
- Convenient in-browser views of logs, metrics, and distributed traces of your containerized resources and .NET projects with the new .NET Aspire Dashboard launch experience
- A new deployment methodology built atop the Azure Developer CLI (AZD), so you'll have multi-node deployment capability in most cases, without needing to write your own infrastructure code
Updates to generated Git Commit Messages
We listened to your feedback and are shortening the output of our generated Git Commit features. Share feedback on this change on the ticket in Developer Community.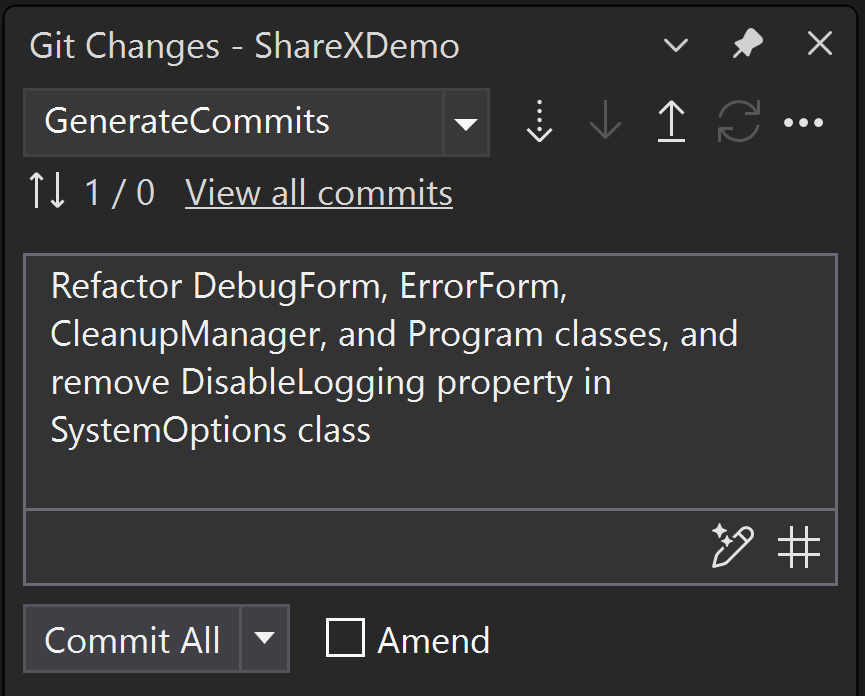
Linking work items to pull requests
The number one request from Azure DevOps users when creating a pull request in Visual Studio was enabling work item linking. Now, you can use the Related Work Item section to view any work items you referenced in your pull request description and link work items to your pull request on Azure DevOps.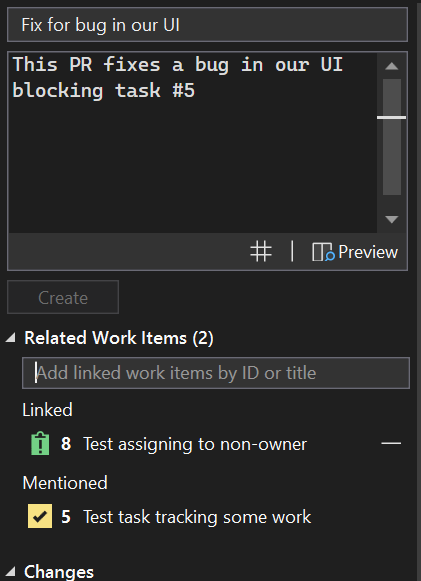
C++
- We have added support for pinning CMake targets in the CMake Targets View. There is a top-level folder now for Pinned Targets. You can pin any targets by right-clicking and selecting the Pin option in the context menu.
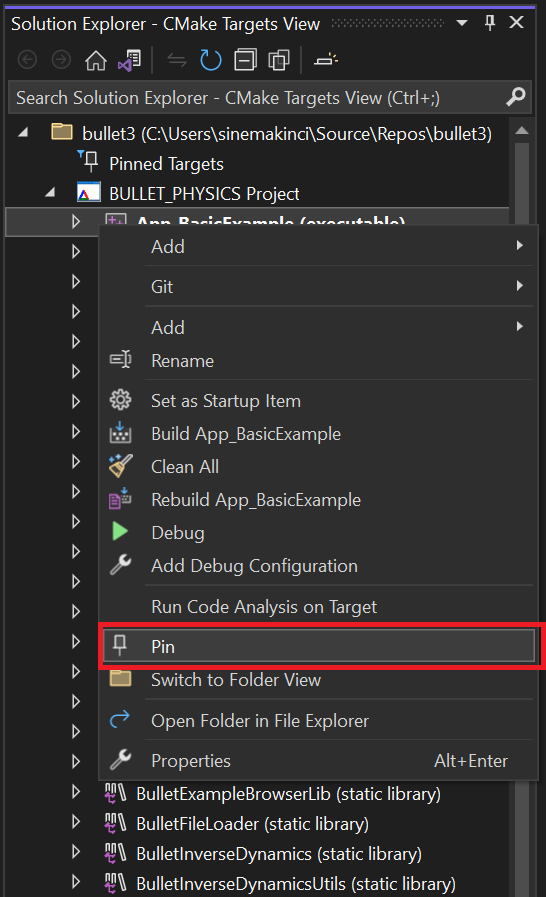
You can also unpin any target in the Pinned Targets folder by selecting Unpin.
- The MSVC toolset will increment its minor version number from 19.39 (VS 2022 v17.9) to 19.40 (VS 2022 v17.10). The MSVC toolset will be version 19.40.33521.0 in the preview 1 release. For more details, see the MSVC Toolset Minor Version Number 14.40 in VS 2022 v17.10 blog post.
- You can now use Build Insights to view your template instantiation information. Template instantiation collection must be activated in Tools > Options > Build Insights.

- We have added additional Unreal Engine Macros to be indented in accordance with the UE Code Style.
- You can now keep our Unreal Engine plugin needed for Unreal Engine Test Adapter running in the background, greatly reducing startup costs. This is an opt-in feature that can be activated via Tools > Options > Unreal Engine.
Known Issues
- Users who have privilege management software from Delinea installed may experience issues launching Visual Studio. Delinea is aware of this issue and has addressed it. Please contact them through Delinea Support and Global Support Phone Numbers to get instructions on how to resolve this issue.”
- Some developers are experiencing hangs when switching between build configurations (e.g. from Release to Debug). Affected developers can set the environment variable 'MSBUILDDISABLEFEATURESFROMVERSION=17.10'. This workaround is intended to mitigate the problem while we work towards a permanent solution. Additional details are available at the Developer Community site
Source:

Visual Studio 2022 Preview Release Notes
Get the latest pre-release features, bug fixes, and support for Visual Studio 2022 Preview. Download today.
learn.microsoft.com


