released Nov 14th, 2023
Summary of What's New in this Release of Visual Studio 2022 version 17.9 Preview 1
Generated Commit Messages
Use the new generated Git commit message feature to help you describe your set of changes. To try it out, you'll need an active GitHub Copilot subscription and the preview GitHub Copilot Chat Extension.
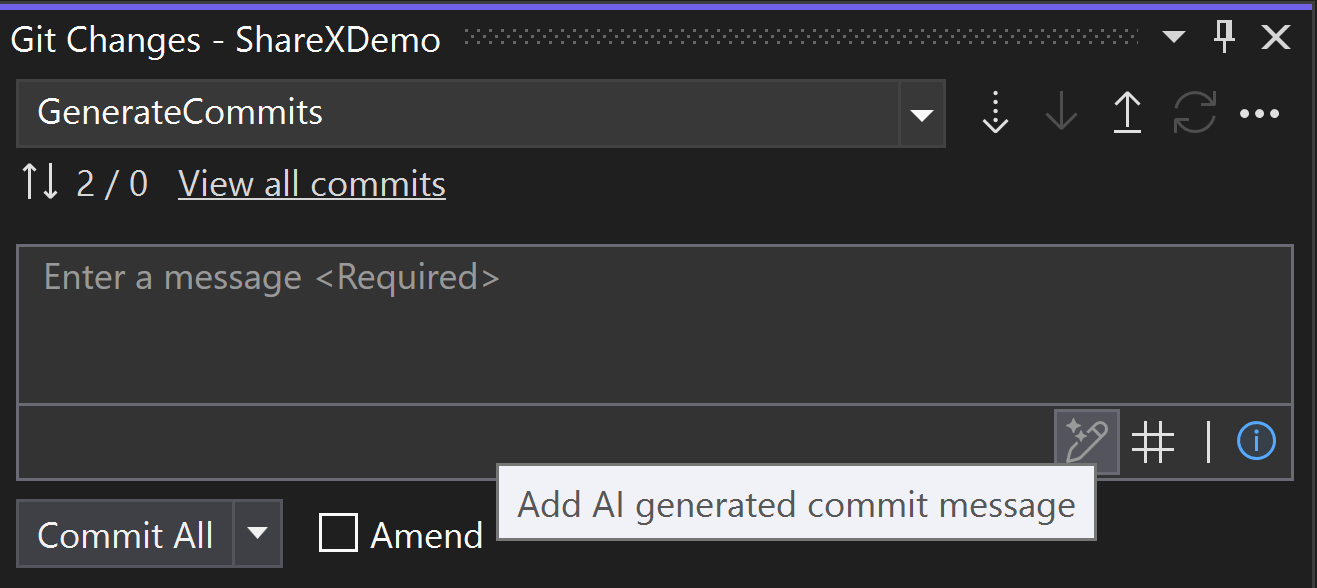
Click on the “Add AI Generated Commit Message” sparkle pen icon in the Git Changes window to generate a suggestion. GitHub Copilot will look at the file changes in your commit, summarize them, and then describe each changes. You can then "Insert AI Suggestion" or "Discard." Share your feedback on this feature here.
Open a Pull Request in Visual Studio or in Browser
To support GitHub and Azure DevOps users who prefer to use the browser view for creating pull requests, we've added a secondary link to help maintain current user flows.

F#
C++
- Fixed a bunch of code fix issues, stabilized and extended their functionality (details here).
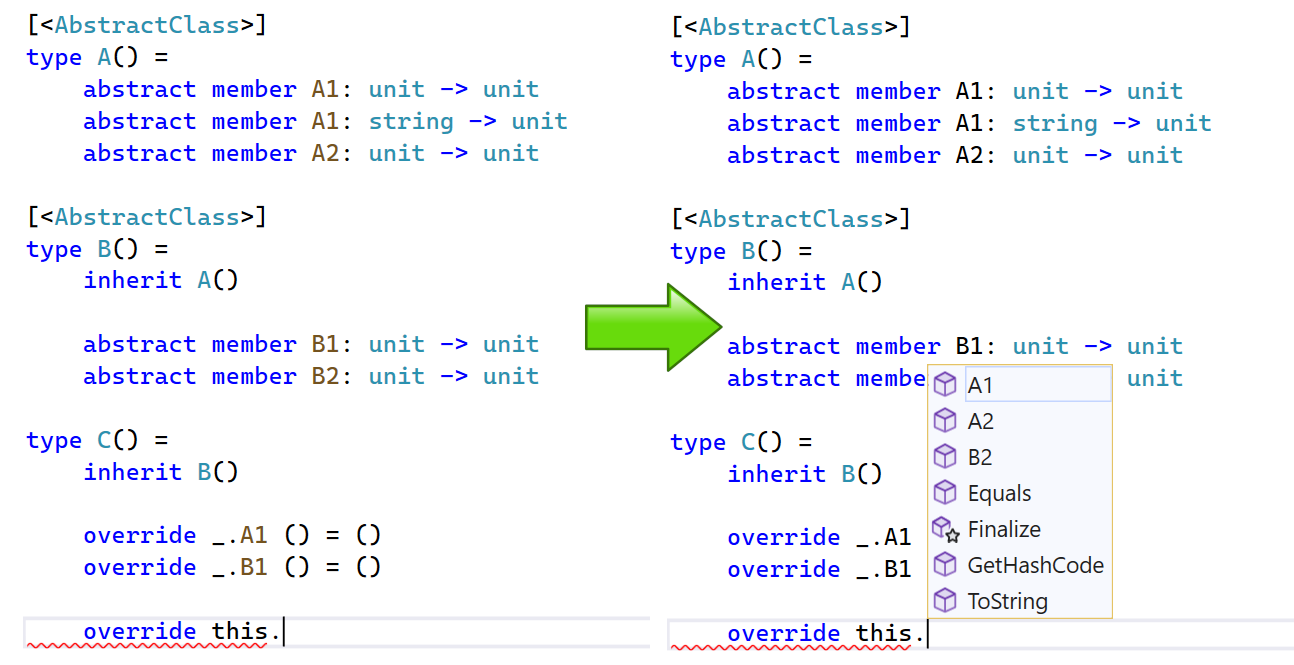
- Enhanced autocompletion in many instances, notably:
- return type annotations:

- record field names:

- overrides:
- Improved go to definition and find references behaviors in some edge cases.
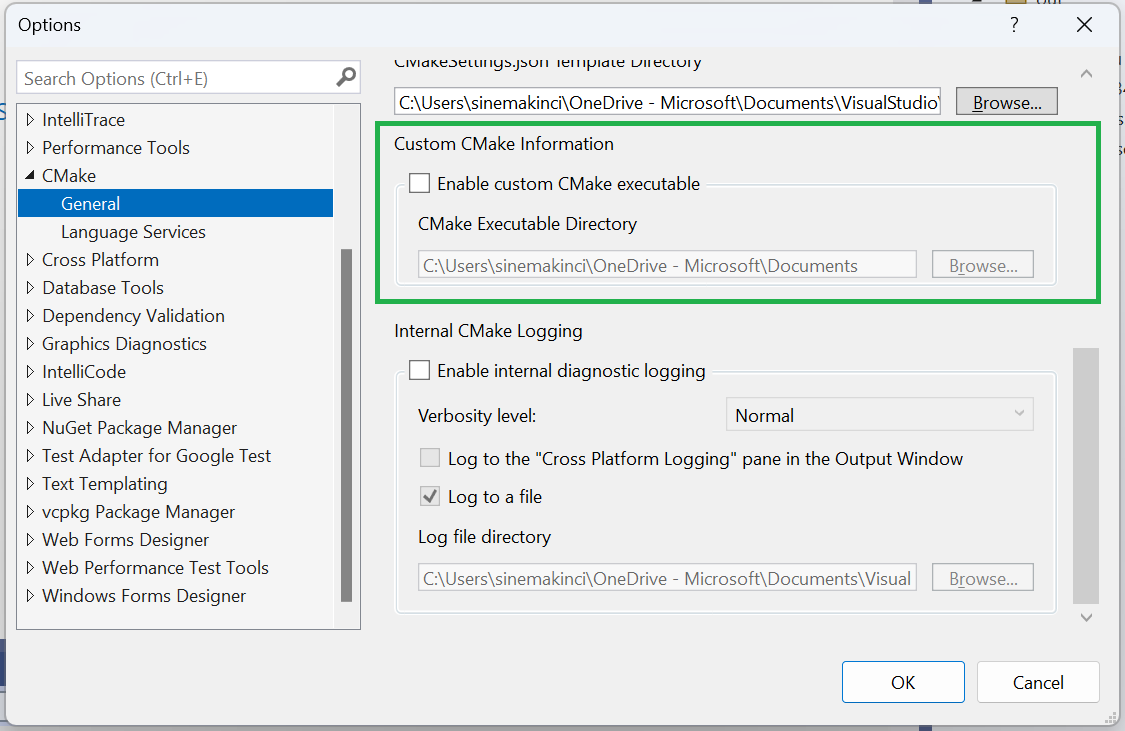
- You can now specify a custom CMake executable if you want to use a specific executable other than the one shipped with VS. To do so, please select Enable custom CMake executable in Tools > Options Options under CMake > General
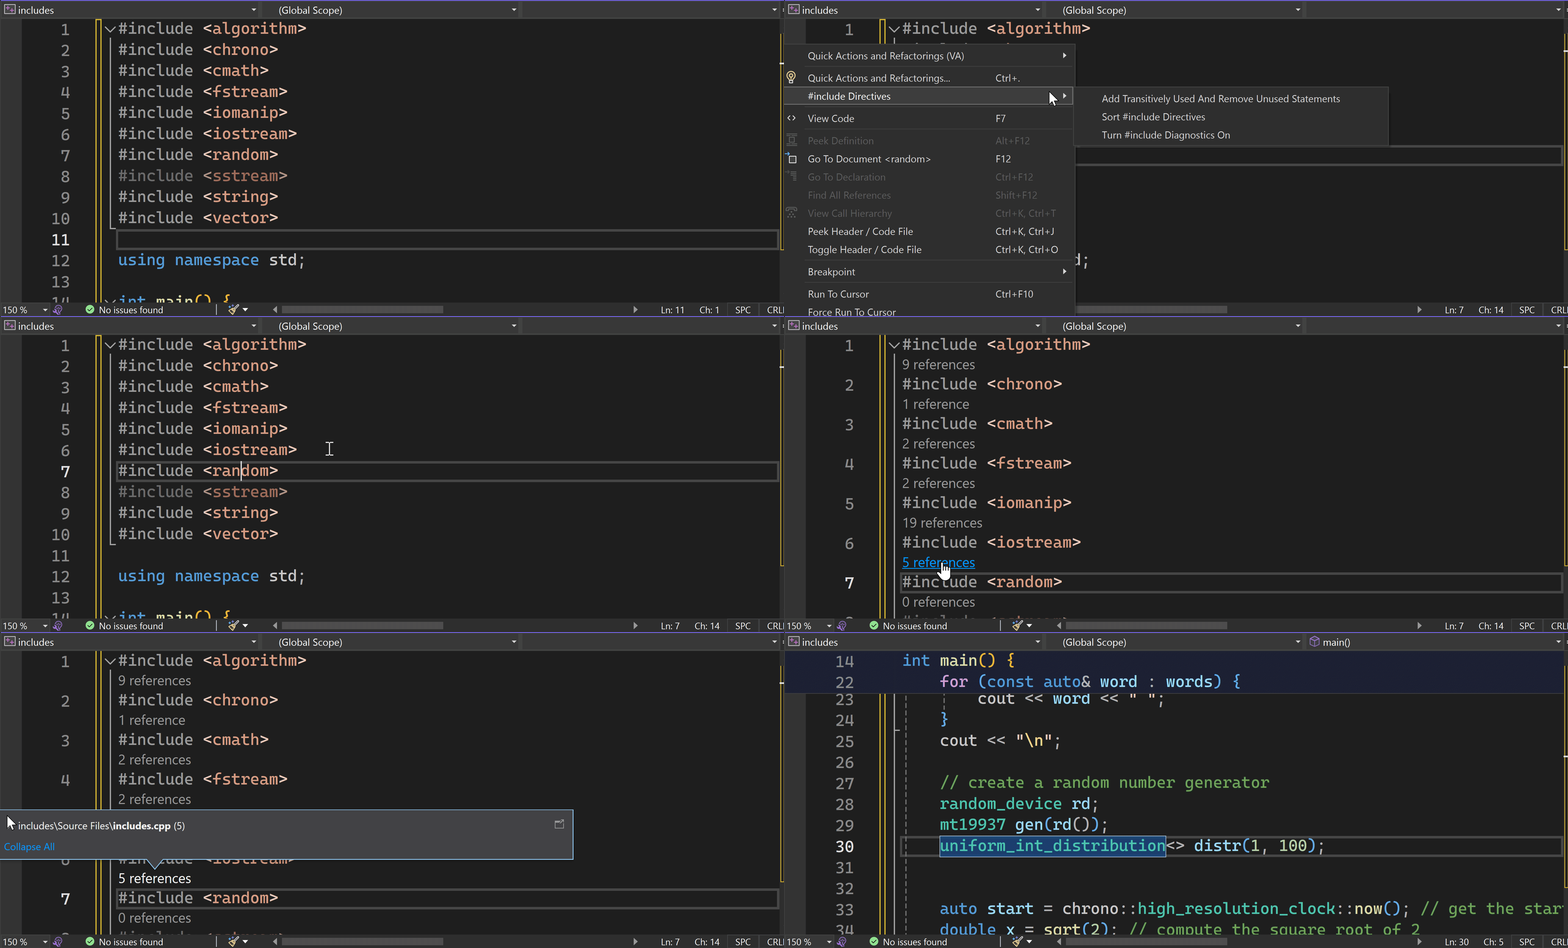
You can now use #include diagnostics to view and access the references of each #include directive in your code. To enable it, right-click in your code editor, select #include Directives, and then choose "Turn #include Diagnostics On".
- Include References Diagnostics
To visualize the memory layout of classes or structs, hover over their names in your code editor, click on the “Memory Layout” link in the Quick Info tooltip, and see the diagram of data members with their padding, offsets, and sizes.
- Memory Layout of C++ Classes and Structs
SQLThis feature is currently in its experimental stage and will undergo gradual enhancements in the Visual Studio 2022 version 17.9 Preview channels.
Developer Community Highlights
Debugging, Diagnostics and Profiling
- Fixed the issue of Visual Studio closes when I use Map component of SSRS. This reduces VS crash.
- Fixed the issue of Problem with changing comparison key in SQL data comparison
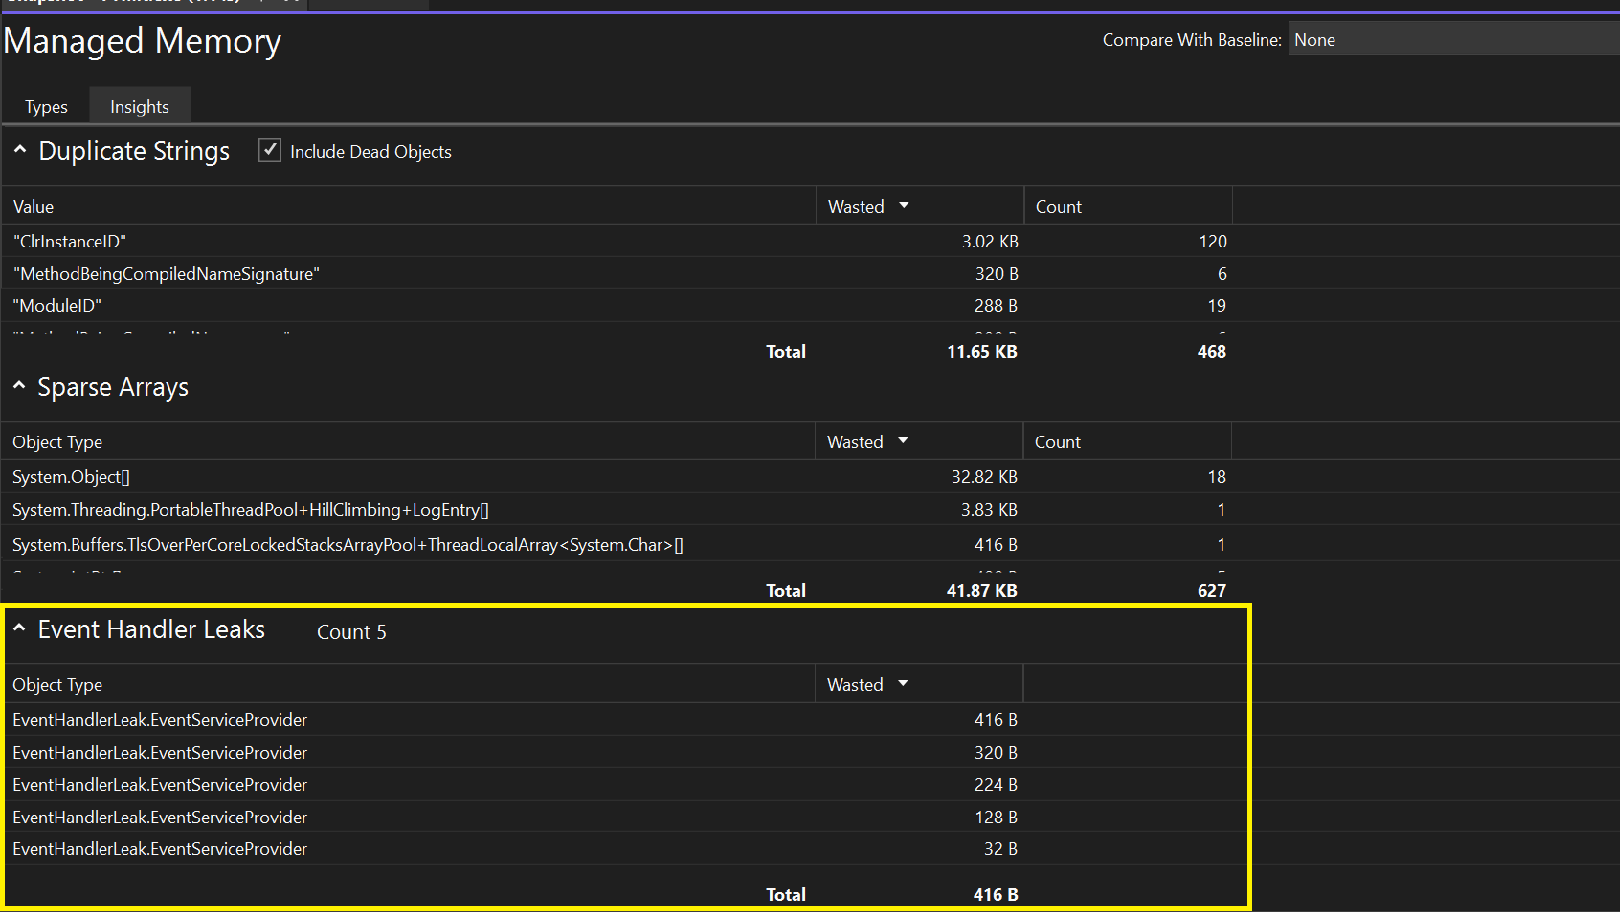
Event Handler Leaks Insights
The "Manage Memory Insights" tab now provides additional helpful information. It can detect "Event Handler Leaks" that can potentially occur, when one object subscribes to another object's event. If the publisher of the event outlives the subscriber, the subscriber remains alive, even if there are no other references to it. This can lead to memory leaks, where unused memory isn't properly freed, causing the application to use more and more memory over time.
Non-modal Debug Visualizers
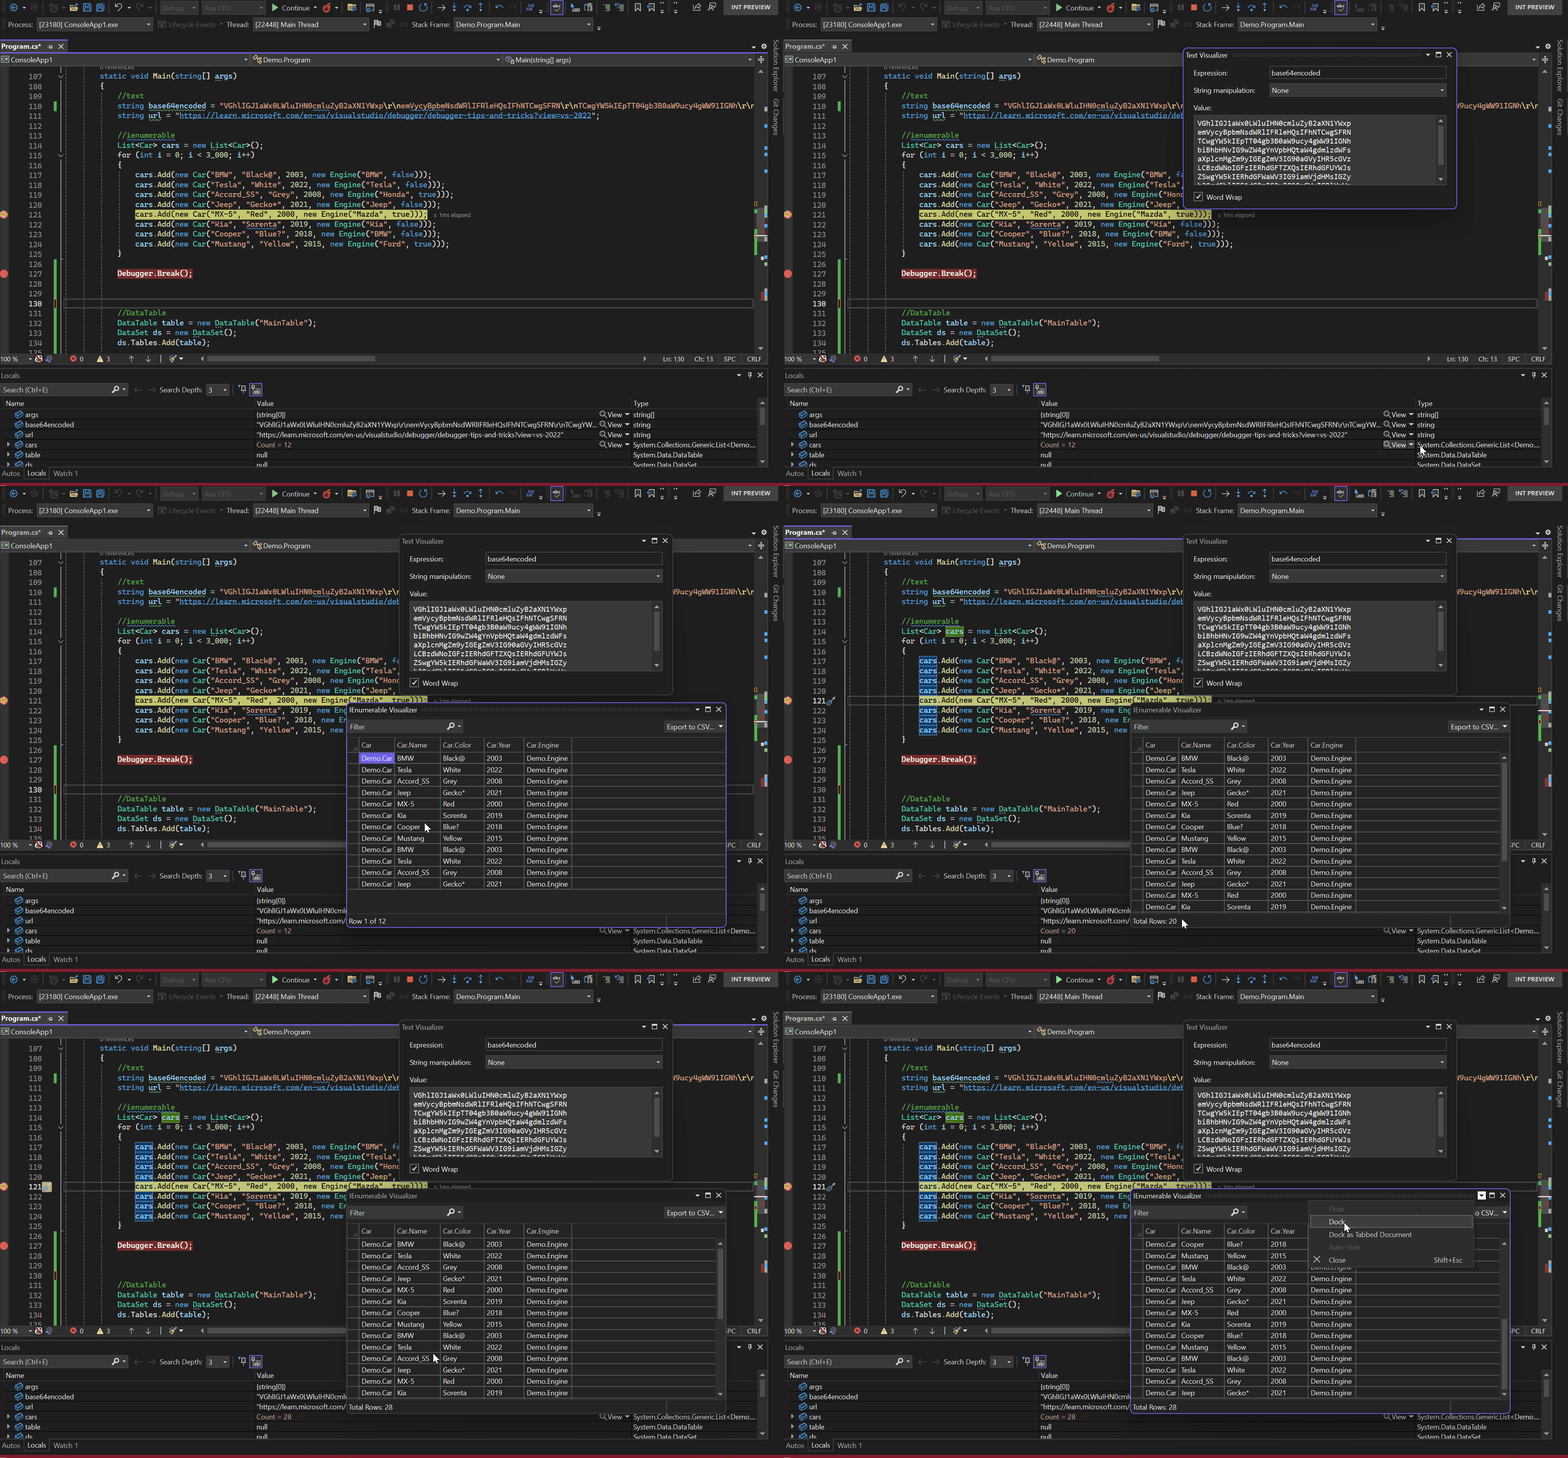
All of the Debug Visualizers are now non-modal, allowing concurrent interaction with the Editor while the visualizer window is active. It is possible to have multiple types of visualizers open simultaneously, and you have the flexibility to choose whether to float or dock your visualizer window.
Automatic Deoptimization
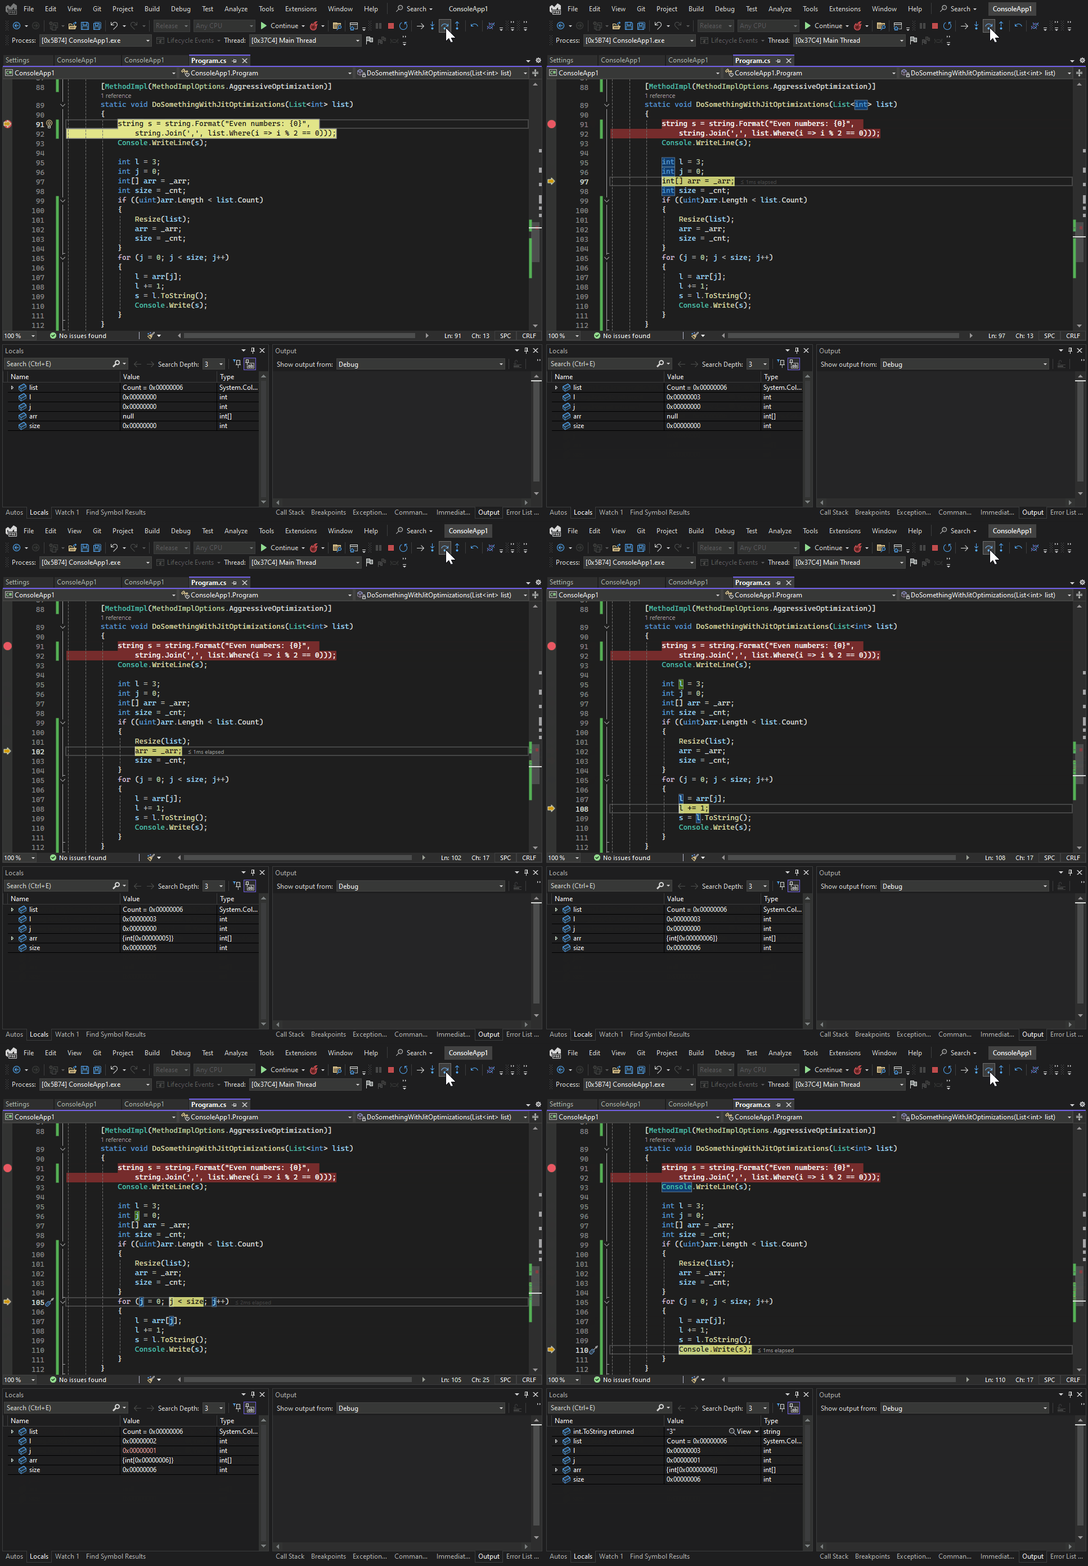
With .NET 8, the Debugger features automatic deoptimization of release binaries and external code during debugging. When you set breakpoints and step through your code, only the specific portions you pause in will be deoptimized, allowing the remainder of the application to maintain optimal performance. To benefit from this feature, the user needs to disable the "Just My Code" option in the debugger settings. This enhancement offers several advantages, including a reduction in errors within the locals, watch, and immediate windows, as well as a decrease in unexpected code navigation while stepping through the application.
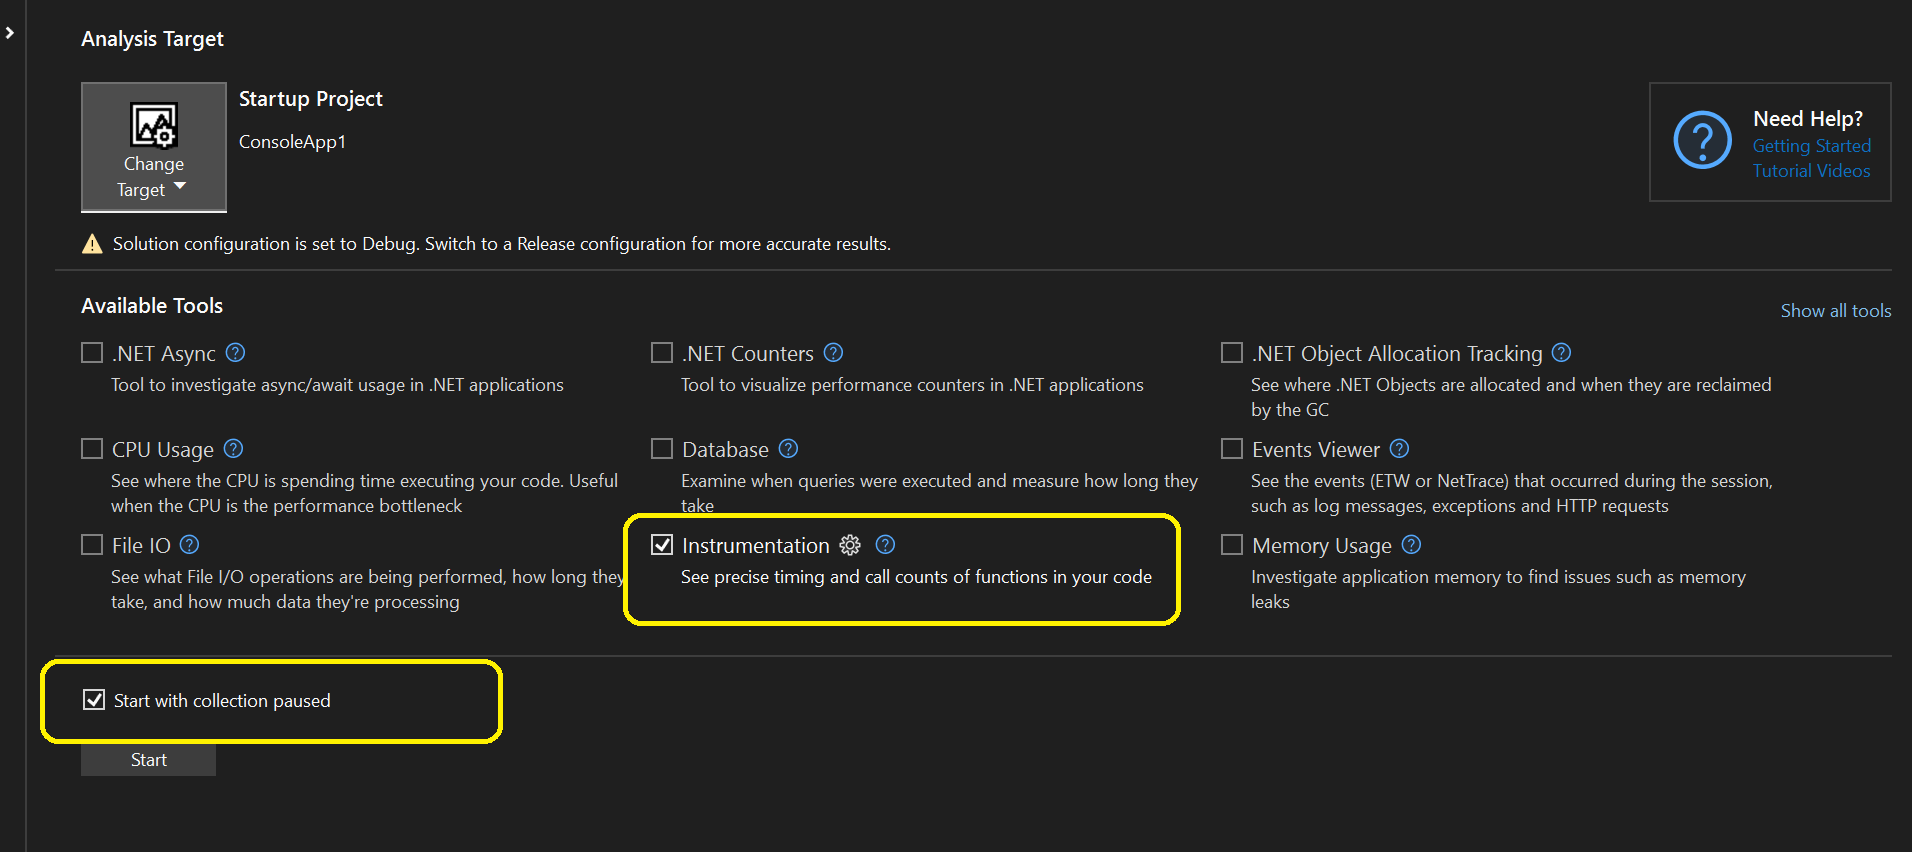
Instrumentation "Start with collection pause" option
The Instrumentation tool has introduced support for the "start-pause" option in application profiling. When selected feature enables the temporary suspension of data collection. Basically, it means starting the application under the profiler's control without actually collecting data. Once you resume using the record button the data collection process, it commences.This functionality is particularly beneficial for scenarios such as gaming, where users prefer to immerse themselves in the gameplay and prepare for reproducing issues before data collection begins. The feature is compatible with both native and managed projects.
C++ Game Dev
Improved Unreal EngineBlueprint Experience in Visual Studio
You can now view Blueprint references and Asset Properties without installing the Visual Studio Integration Tool plugin. The update removes the requirement for building your game before gathering Blueprint information. Your Blueprint reference experience will be greatly improved as Visual Studio will now display CodeLens hints with less machine resources and reduced latency.
Improved IntelliSense Support for Unreal Engine ProjectsThis is currently an experimental feature and will be gradually made available to Unreal Engine developers in the coming weeks on the Visual Studio 2022 version 17.9 Preview channels.
We have improved the handling of Unreal Engine IntelliSense by ensuring consistency and accuracy. . IntelliSense in Visual Studio will now refresh more readily for Unreal Header Tool generated files, reducing the likelihood of displaying unwarranted errors.
Switch between single and multiple tab rows in the document well
You can now quickly switch between single and multiple tab rows in Visual Studio's document well by scrolling the mouse wheel up or down. The first time you open more tabs in Visual Studio than can fit in a single row in the document well, you'll see a tip letting you know of this new feature.
Scrolling down on the mouse wheel while hovering over the tabs in the document well will shift your view to show multiple tab rows. Conversely, scrolling up on the mouse wheel will collapse the view down to a single tab row.
UI Refresh Preview and Tinted Themes
The UI Refresh is now available for folks to try out for themselves. To enable the UI Refresh, go to Tools > Manage Preview Features and Check the "Experimental control styles" option. Once the option is checked, Visual Studio will need to be restarted.
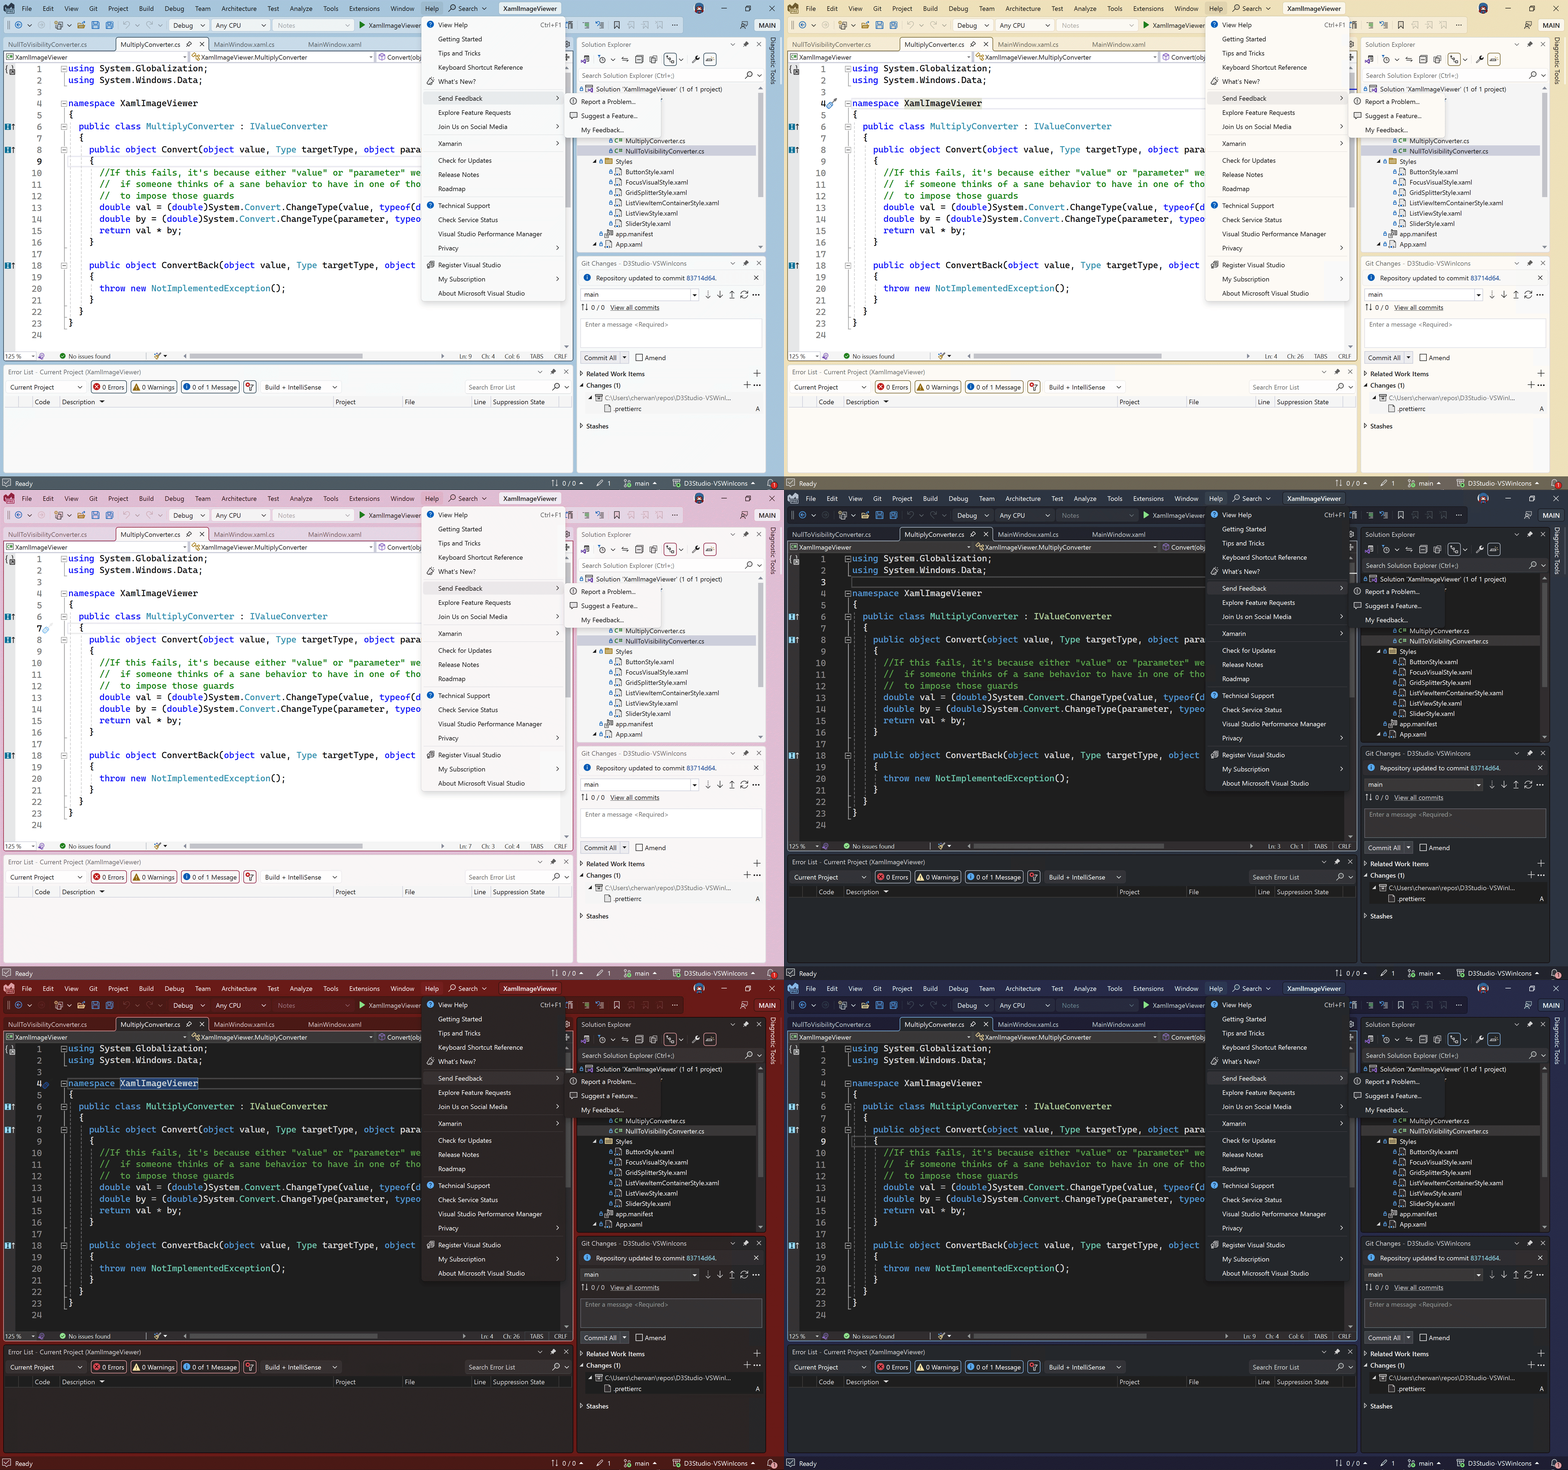
When the UI Refreh preview is enabled, the new tinted themes are available. The new themes can be found under Tools > Theme, or in the "Color Theme" combobox in Tools\Options under Environment > Visual Experience. The Blue theme is not available when the UI Refresh is enabled and custom themes may not be compatible with the UI Refresh.
Build and Debug .NET SDK containers
We have added the ability to easily build and debug your ASP.NET projects in a container without a dockerfile. Adding .NET SDK Container support will leverage the .NET container rather than requiring a Dockerfile in your project.
To enable support: Right click your ASP.NET project -> Add -> Docker support -> Select .NET SDK Container Debug type and your desired target operating system.
Let us know what you think of the feature by submitting suggestions here or by reporting issues here
Blazor Scaffolding for .NET 8 Projects
We have added the ability to scaffold views in .NET 8 Blazor web projects. This includes scaffolding views that use Entity Framework for CRUD (Create-Read-Update-Delete) operations.
For more info see the release blog post.
Windows Subsystem for Android
You can now test and debug your Android apps on Windows Subsystem for Android (WSA) with Visual Studio. If WSA is installed, it will automatically show up as an available debug target for .NET MAUI and .NET Android projects. If WSA is detected on your system, Visual Studio will display it under Android Local Devices in the debug targets menu.
Select it and start a debug session (F5) to build and deploy your Android app to WSA. If developer mode is not enabled, Visual Studio will guide you to enable it. Learn about system requirements and how you can install Windows Subsystem for Android.

Known issues
- If you have the Game Development with Unity workload installed and you're opening a non-Unity C# or Visual Basic project, IntelliSense will not work due to an issue in the Visual Studio Tools for Unity. IntelliSense will continue to work for Unity projects. This issue will be fixed in the next preview.
Mobile Development
The Pair to Mac auto-discovery capability fails to display new devices on the network. Even though a Mac is not displayed in the list of devices, one can connect to the Mac via it's IP address. This issue also exists for new computers running Visual Studio for the first time and connecting via IP address is required.
Source:

Visual Studio 2022 Preview Release Notes
Get the latest pre-release features, bug fixes, and support for Visual Studio 2022 Preview. Download today.
learn.microsoft.com


