DirectX Developer Blog:
Today we released DxTimingCaptureLibrary, an open-source C++ library for DirectX developers. It is available on GitHub under the MIT license, and it works on all versions of Windows 10 and 11.
DxTimingCaptureLibrary makes it easier to understand DirectX ETW events and bring their rich information into tools such as in-engine game profilers.
What is DxTimingCaptureLibrary?
ETW (Event Tracing for Windows) is a Windows feature for collecting detailed system and application events with low overhead. DirectX components such as the D3D12 runtime, DXGI, and the DirectX kernel emit ETW events when important activity occurs.DxTimingCaptureLibrary helps game developers interpret these events and turn them into actionable insights. It handles the complex work of interpreting and correlating ETW events from multiple sources, and then it makes simple callbacks into application code so that developers can use the information however they need.
The library includes samples that show how to configure ETW sessions and how to use DxTimingCaptureLibrary.
We created DxTimingCaptureLibrary by extracting code from PIX Timing Captures and moving it into a standalone project. All DirectX data shown in the PIX Timing Capture UI is available through DxTimingCaptureLibrary.
What can the library do?
The library exposes information such as:- GPU timing data.
- Includes top-of-pipe and bottom-of-pipe timestamps for each command-list work item.
- Timestamps are populated by the driver through D3D history buffers.
- API object creation and destruction.
- Includes timestamps, object size, parameters, and debug names.
- Residency and paging events.
- Shows when the DirectX kernel moves objects between video and system memory due to paging or eviction.
- It also shows migration failures, for example due to VRAM fragmentation.
- DirectStorage events.
- Includes read and status requests.
- D3D runtime failure logs.
- Pipeline state compilation events.
- Monitor VSync events.
- WinPixEventRuntime events/markers on both the CPU and GPU timelines.
- PIX custom counter data, via the WinPixEventRuntime counter APIs
How do I get started?
The README in the GitHub repository has the latest getting-started instructions. At a high level, you need to:- Create and configure an ETW session with the appropriate DirectX ETW events.
- The various samples (below) show how to do this.
- Configure the ETW session’s event handler to call DxTimingCaptureLibrary’s event handler.
- Implement any DxTimingCaptureLibrary callback interfaces that are relevant to your scenario.
- Wait for DxTimingCaptureLibrary to invoke your callbacks when the appropriate events occur.
What are the samples?
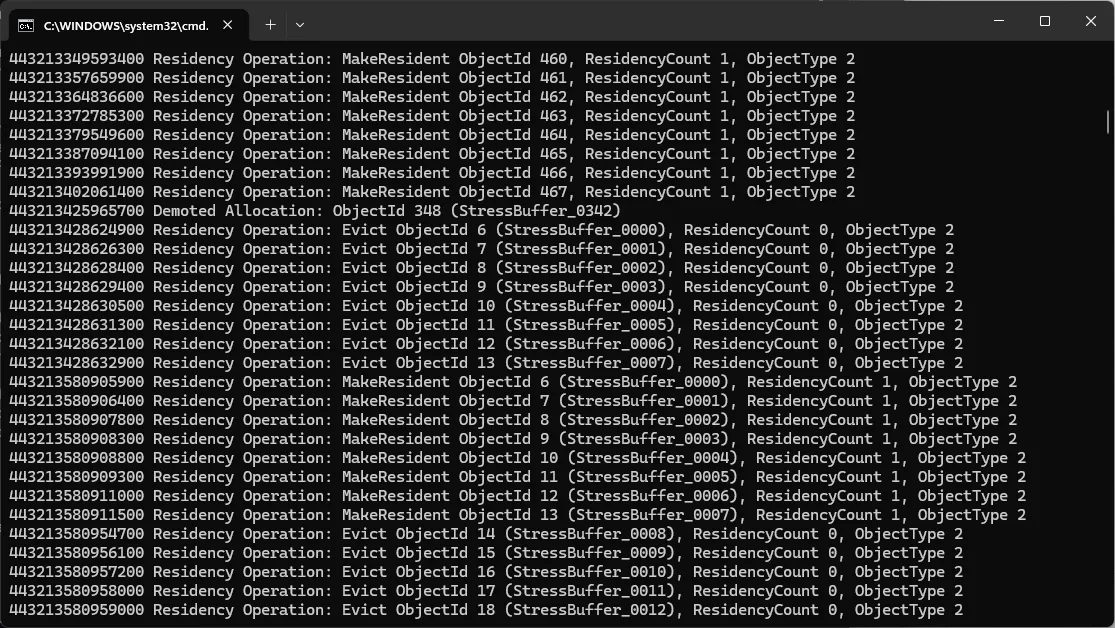
The library includes several samples:Basic Residency Logging: This barebones sample provides printf-based implementations of each DxTimingCaptureLibrary callback, which log event data to the console output window. It has an optional mode to only log DirectX residency/paging events, including MakeResident/Evict, Paging In/Out, and migration failures. This sample is a good place to get started with the library.
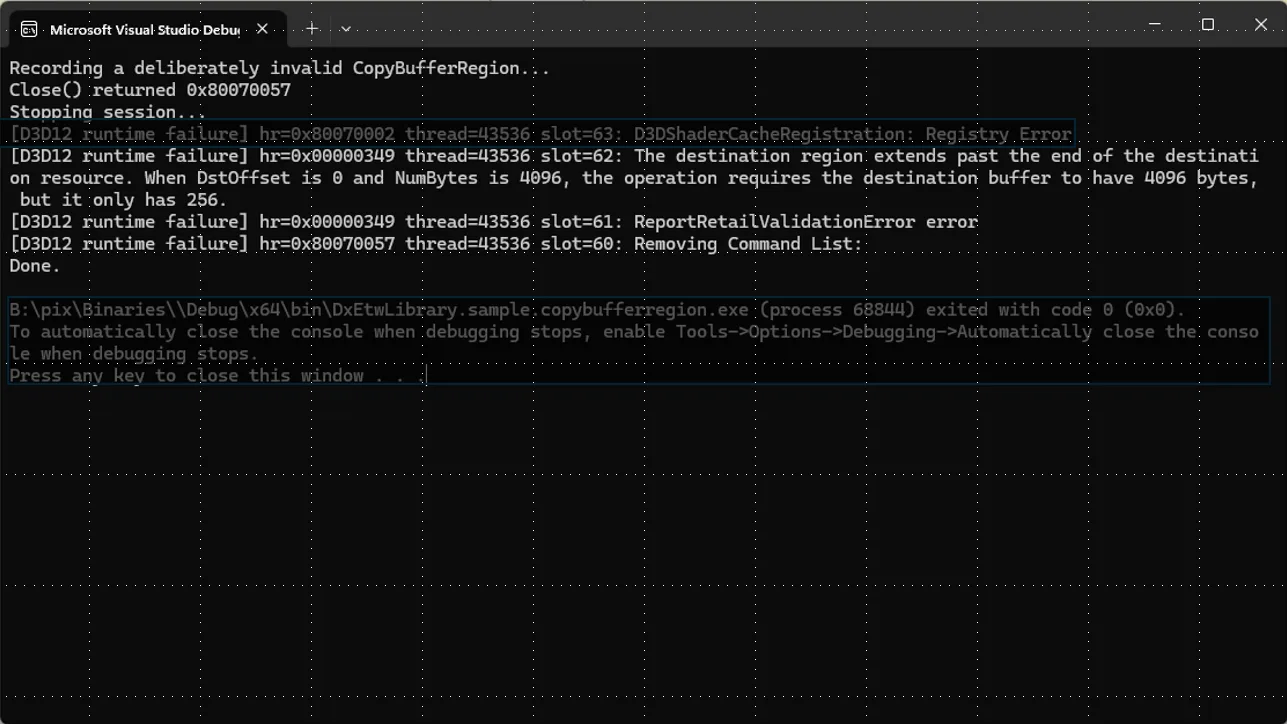
D3D12 Journal Entries: This sample implements the D3D12 Journal callbacks in DxTimingCaptureLibrary to receive a notification when an error occurs in D3D12 code. For example, the sample intentionally makes an invalid D3D12 API call by closing a command list that contains an invalid CopyBufferRegion() call. DxTimingCaptureLibrary reports this through the journal callback. The callback provides less detail than the D3D12 debug layer but it provides more detail than the regular D3D12 APIs – and it works in retail D3D12 environments!
Perfetto: This sample implements the GPU timing data callbacks in DxTimingCaptureLibrary and uses them to generate a Perfetto trace file. The trace shows each command list event’s top-of-pipeline and end-of-pipeline timestamp on the GPU timeline, and it connects the data to a marker on the CPU timeline showing when the command list event was recorded. It also shows you other processes’ GPU work and how they might be interferring with your process.
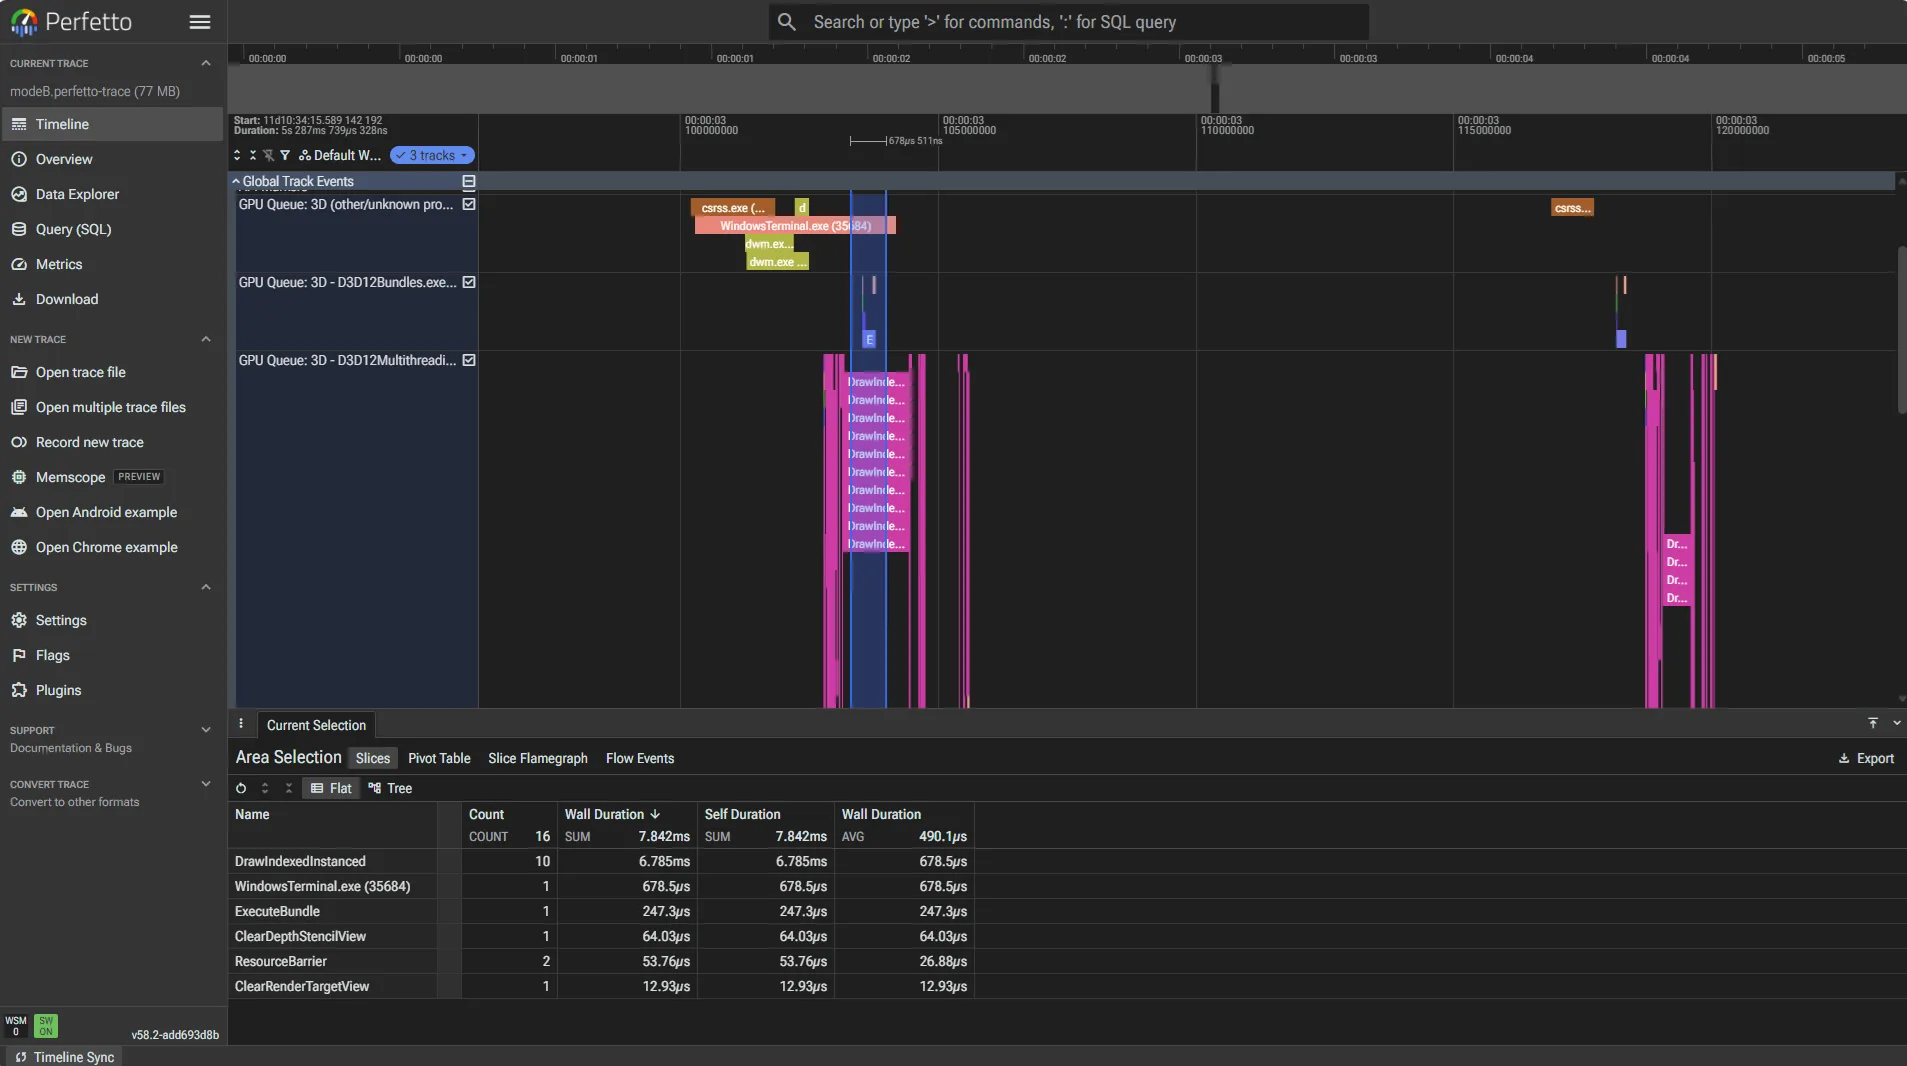 Perfetto Sample Screenshot
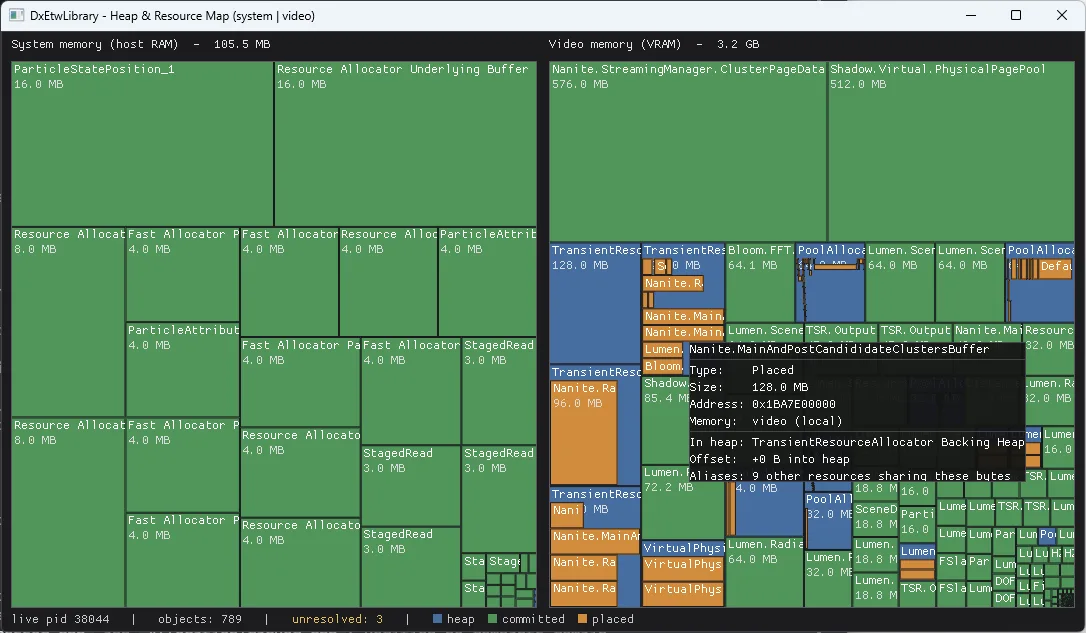
Memory Treemap: (work in progress) This sample listens to the resource creation and residency event callbacks in DxTimingCaptureLibrary. It uses that data to populate two treemaps showing resource and heap usage in system memory and video memory, while taking paging and residency events into account.
Source: