Microsoft 365 Insider Blog:
Hi, Insiders! I’m Ndeyanta Jallow, a Product Manager on the Excel team. I’m excited to announce a powerful new Python capability in Microsoft Excel for Windows, Excel for Mac, and Excel for the web: images as input.
Analyze images with Python in Excel
Analyzing, manipulating, and gathering important information from images in Excel just became easier and faster! This feature unlocks a whole new class of data analysis workflows: Now you can drop an image into a cell and run Python code on it with no extra tools or steps.How it works
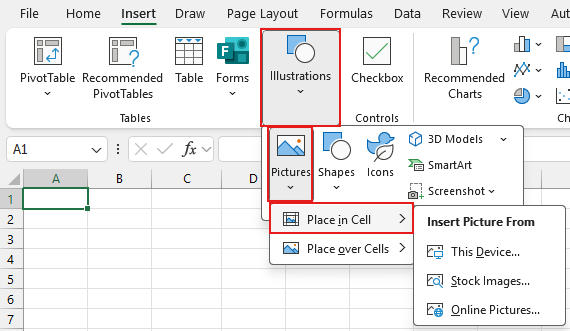
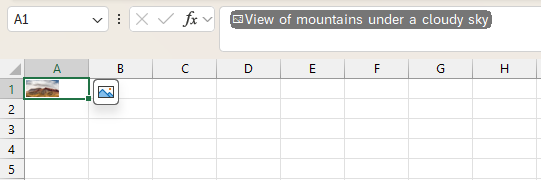
Let’s work through an example of how to analyze images with Python in Excel. Follow along with the steps outlined below to detect if an image is likely blurry or sharp. The code checks how much detail is in an image by applying a special filter. If there’s not much variation, it means the image is probably blurry; if there’s a lot, it’s likely sharp.- Insert an image into cell A1 by selecting Insert > Illustrations > Pictures > Place in Cell, and select an image from your device, from a stock library, or from an online source. Then, select Insert.
NOTE: To reference the image in Python code, it must be in a single cell and not over cells.
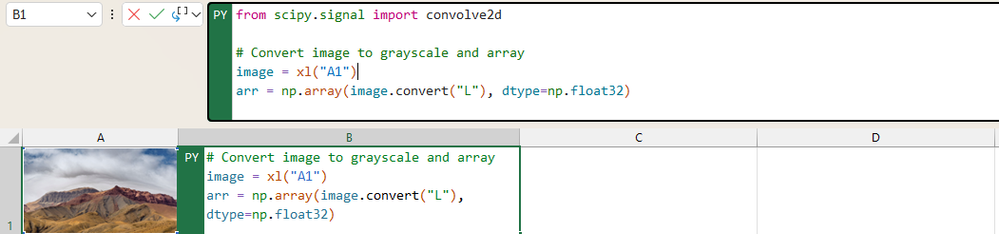
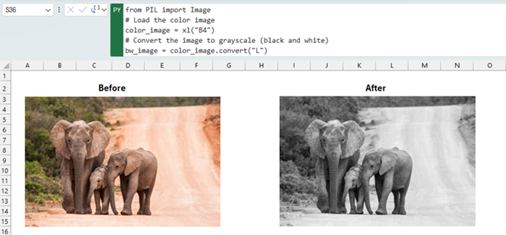
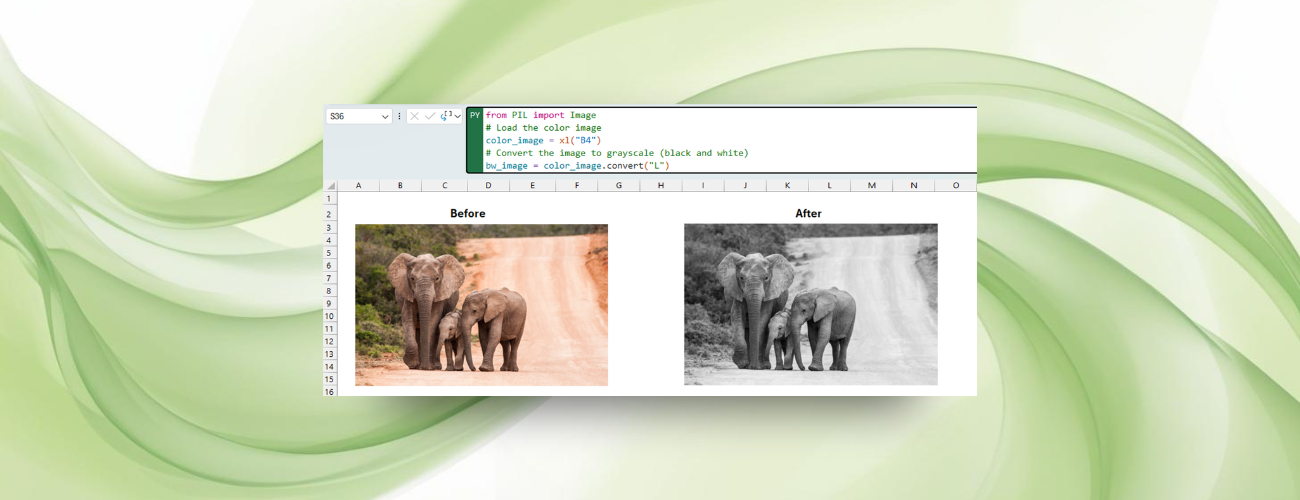
- In cell B1, create a Python formula by typing =PY( into the cell. Copy and paste the following code into cell B1 to analyze the image in cell A1:
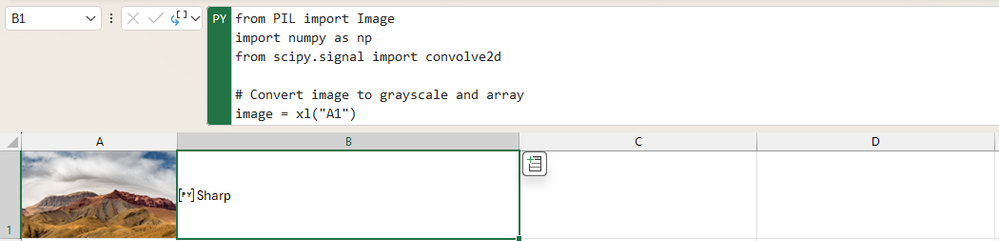
Code:from PIL import Image import numpy as np from scipy.signal import convolve2d # Convert image to grayscale and array image = xl("A1") arr = np.array(image.convert("L"), dtype=np.float32) # Apply Laplacian filter laplacian = convolve2d(arr, [[0, 1, 0], [1, -4, 1], [0, 1, 0]], mode='same', boundary='symm') # Classify based on variance "Blurry" if np.var(laplacian) < 100 else "Sharp"
NOTE: Just like referencing ranges and tables, image is referenced in the code above with the xl() function. You can reference cells with images in Python code by typing xl(“A1”) or selecting the cell that contains the image while in edit mode.
- Press Ctrl + Enter to run the code, and then notice that “Sharp” or “Blurry” is displayed in the cell based on the quality of the image analyzed.
Tips and tricks
- Check out our introduction to Python in Excel and get started with Python in Excel articles for more information on how to use Python in Excel.
- To analyze images with Python, Pillow is currently the most useful library available. It provides efficient tools for opening, processing, and analyzing image data, including pixel-level access, filtering, transformations, and metadata extraction.
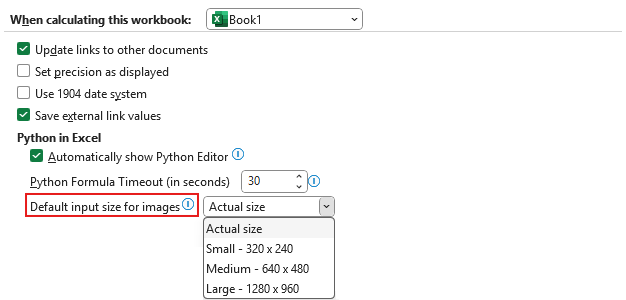
- To help manage performance and stay within the per-cell data limit, we’ve added a new setting under File > Options > Advanced >When calculating this workbook > Python in Excel. You can choose to adjust your image size to Actual size (default), Large (1280x960), Medium (640x480), or Small (320x240). If you exceed the per-cell data limit, you’ll see a helpful error with guidance on how to adjust your settings.
Scenarios to try
Here are other image analyses you can conduct using Python in Excel:- Image manipulation: You can adjust brightness, change color, overlay logos, or watermark product images for brand consistency.
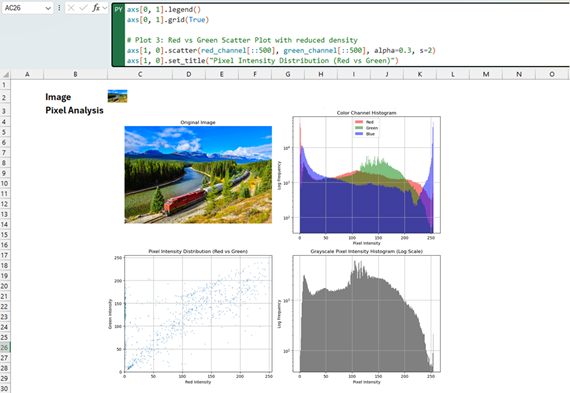
- Metadata analysis: Try analyzing image metadata and generating plots to explore image structure and composition.
Availability
This feature is available to Excel users who have access to Python in Excel (learn more) and are running:- Windows: Version 2509 (Build 19204.20002) or later.
- Mac: Version 16.101 (Build 25080524) or later.
Feedback
Have ideas for how you’d use images in Python in Excel? Want to see more image libraries supported? Let us know in the comments below, or select Help > Feedback in Excel to provide your thoughts and suggestions! Source:
Analyze images with Python in Excel
Now you can drop an image into a cell in Microsoft Excel for Windows, for Mac, and for the web and run Python code on it with no extra tools or steps.
 techcommunity.microsoft.com